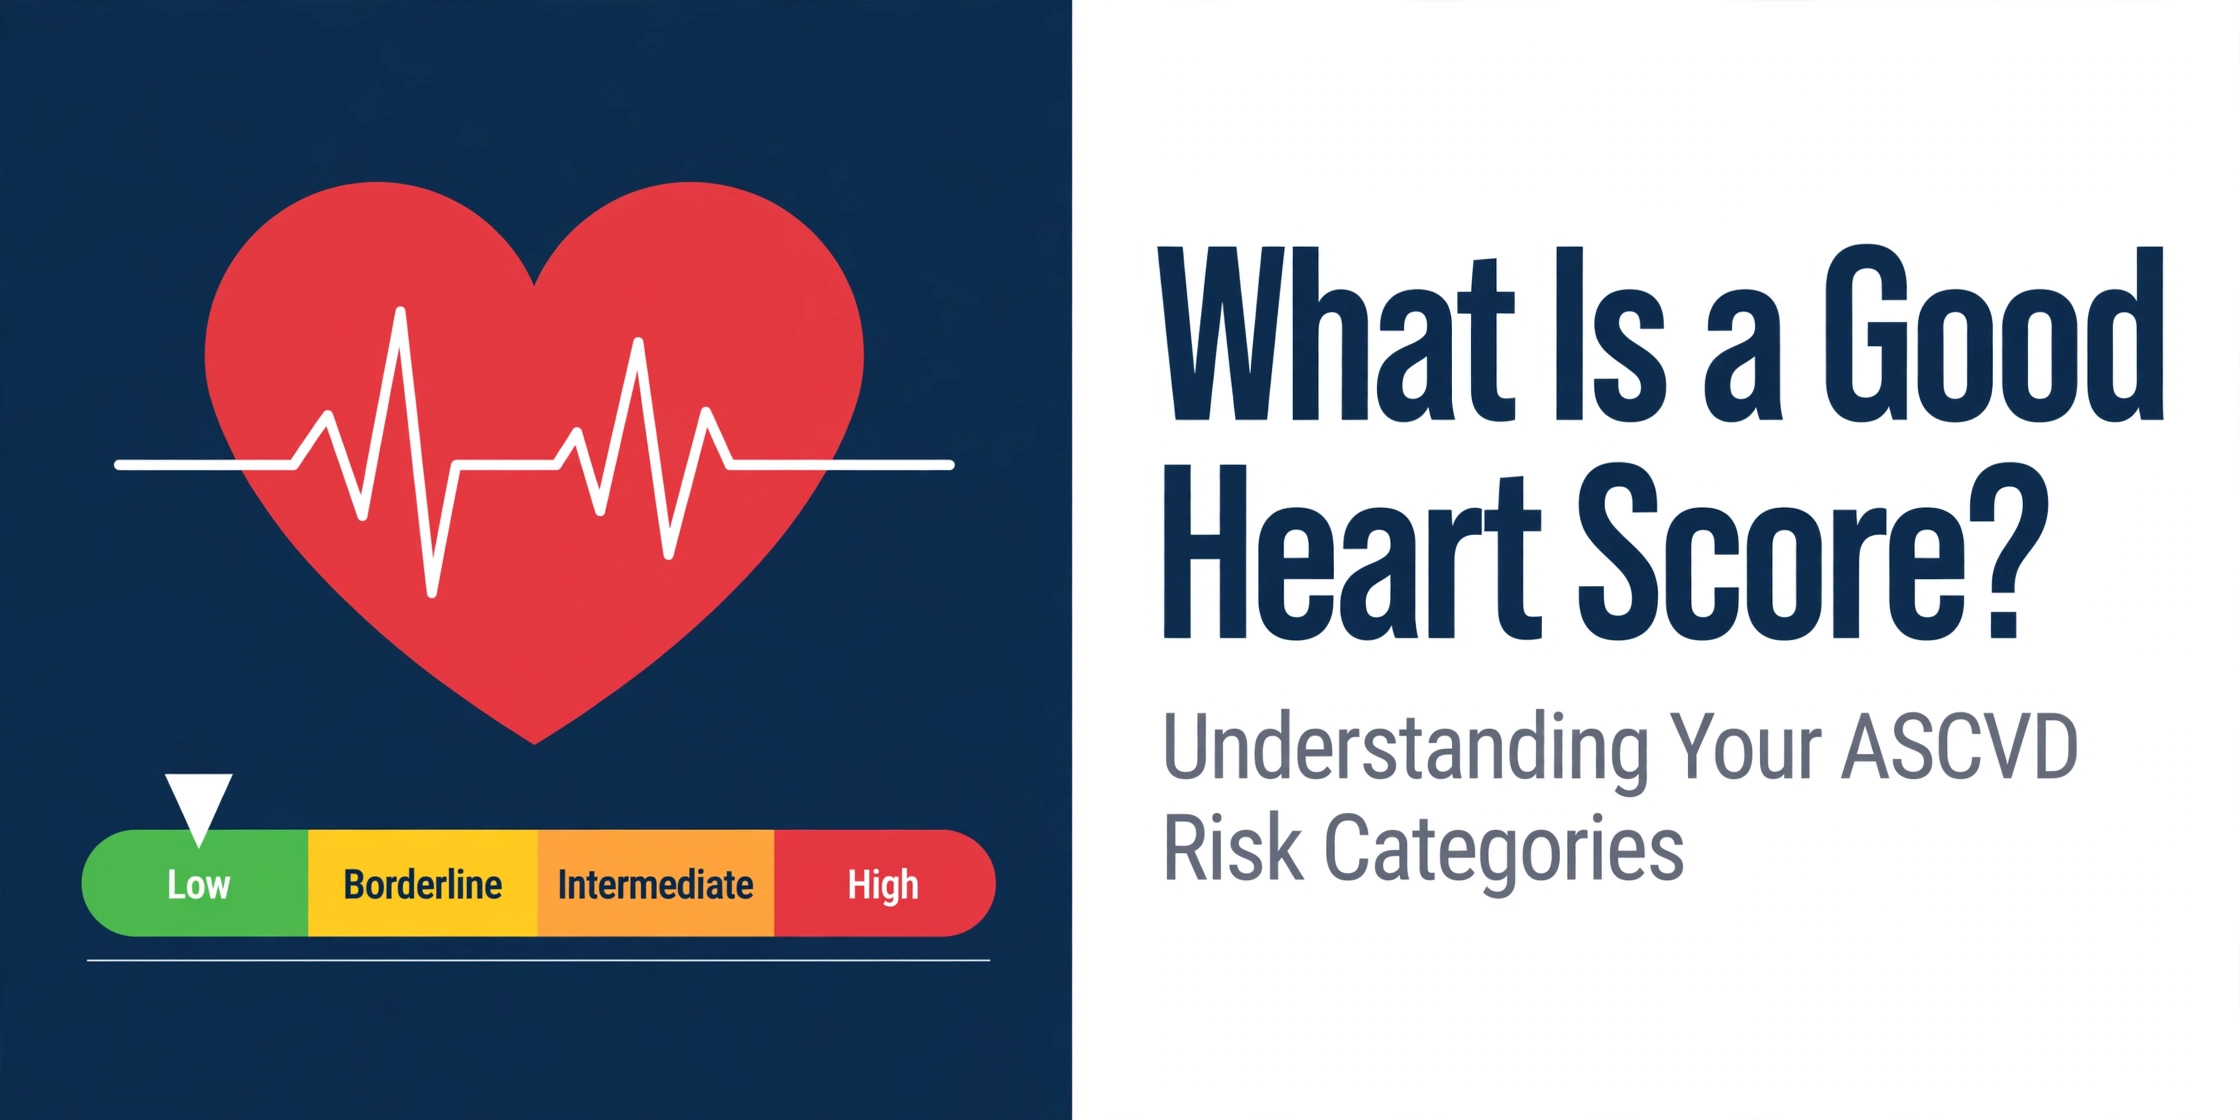
Clear, peer-reviewed clinical education on cardiovascular risk scores, cholesterol guidelines, blood pressure thresholds, and metabolic health.
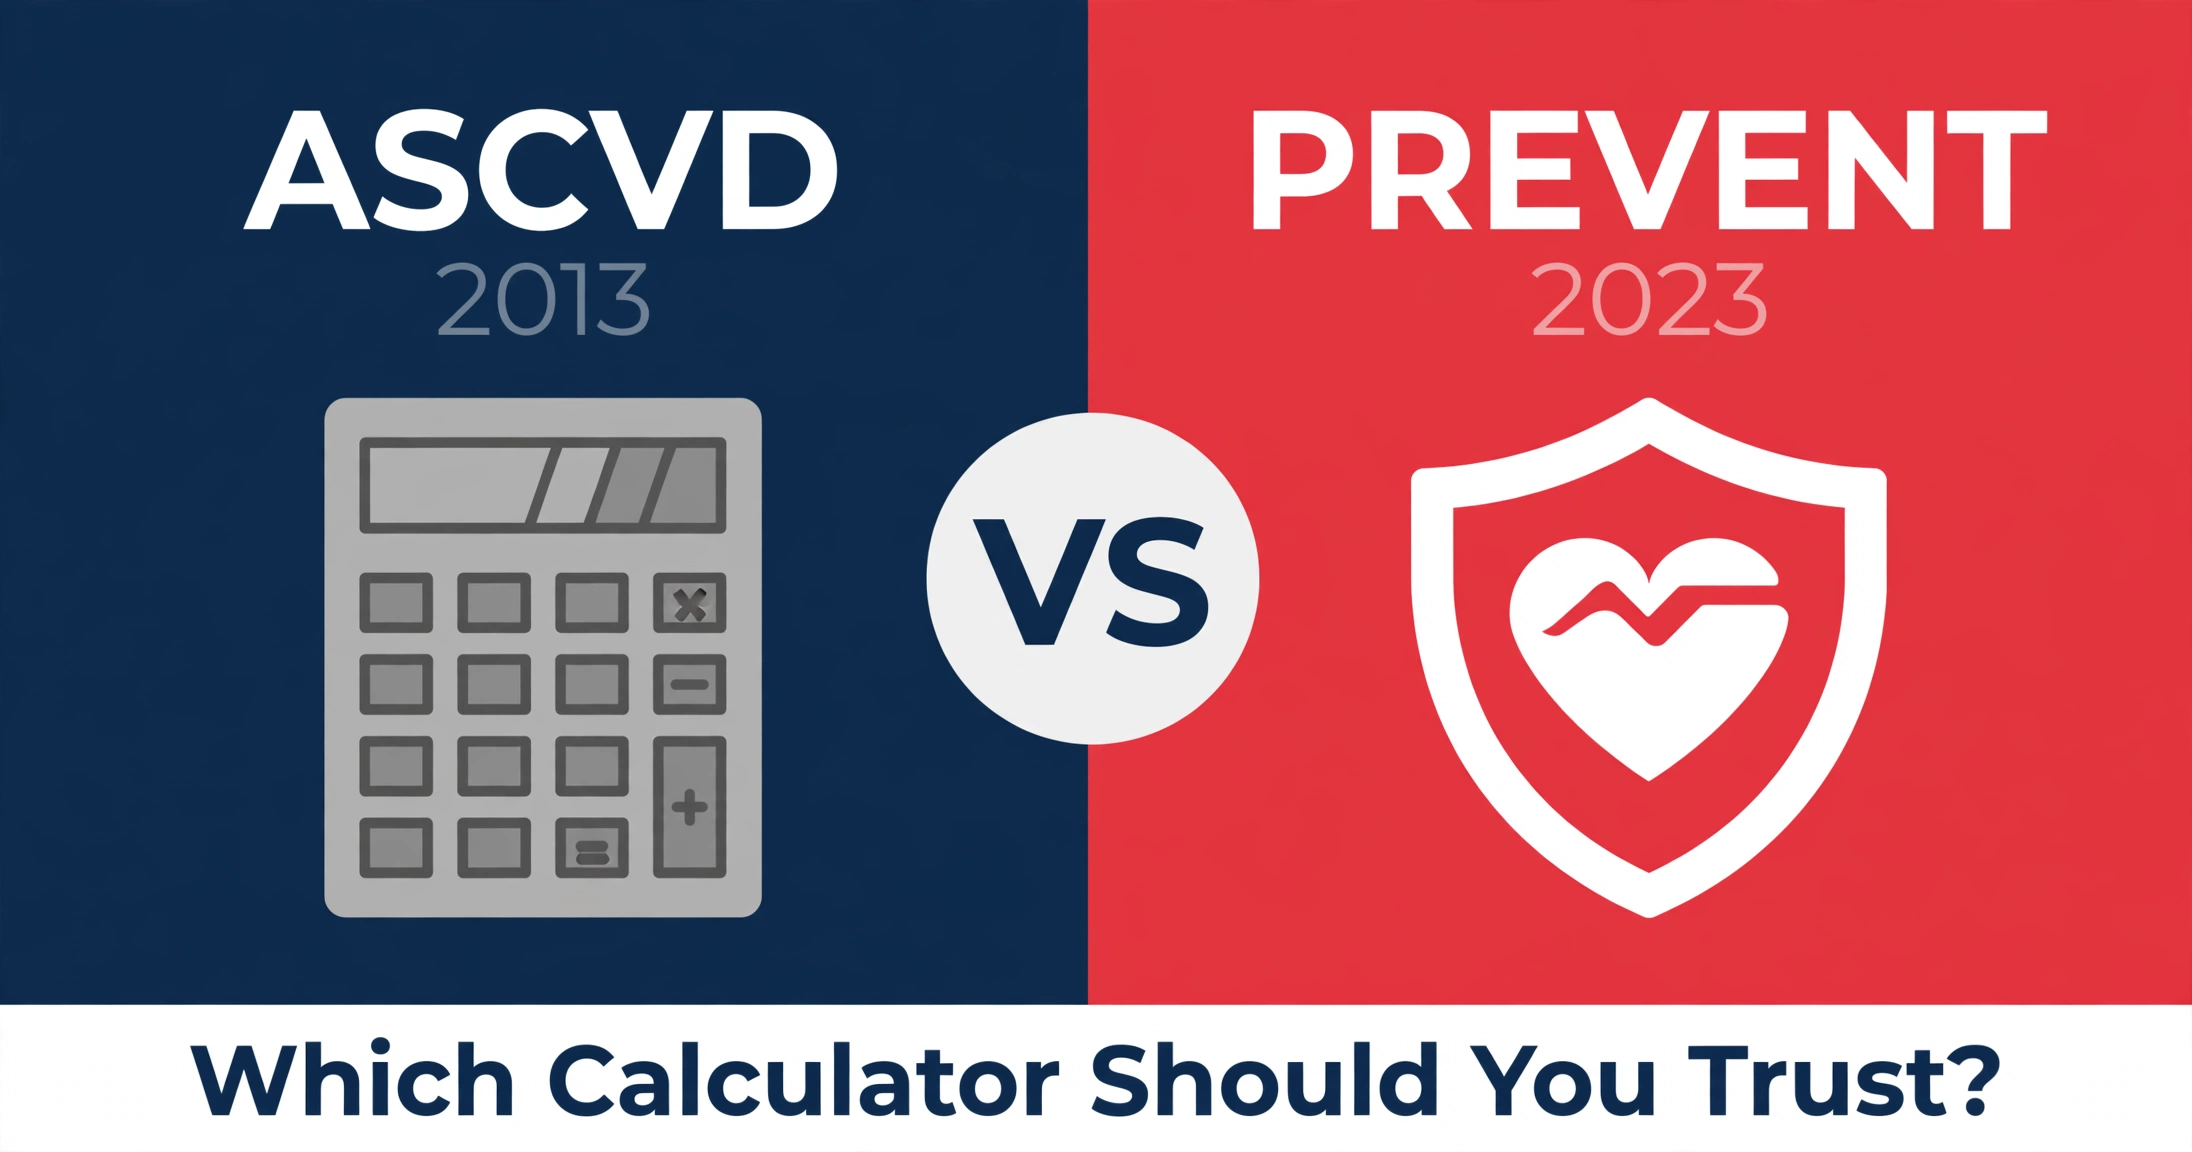
The AHA introduced PREVENT in 2023 as the modern replacement for the 2013 ASCVD Pooled Cohort Equations. Learn how kidney health and social factors alter risk predictions.
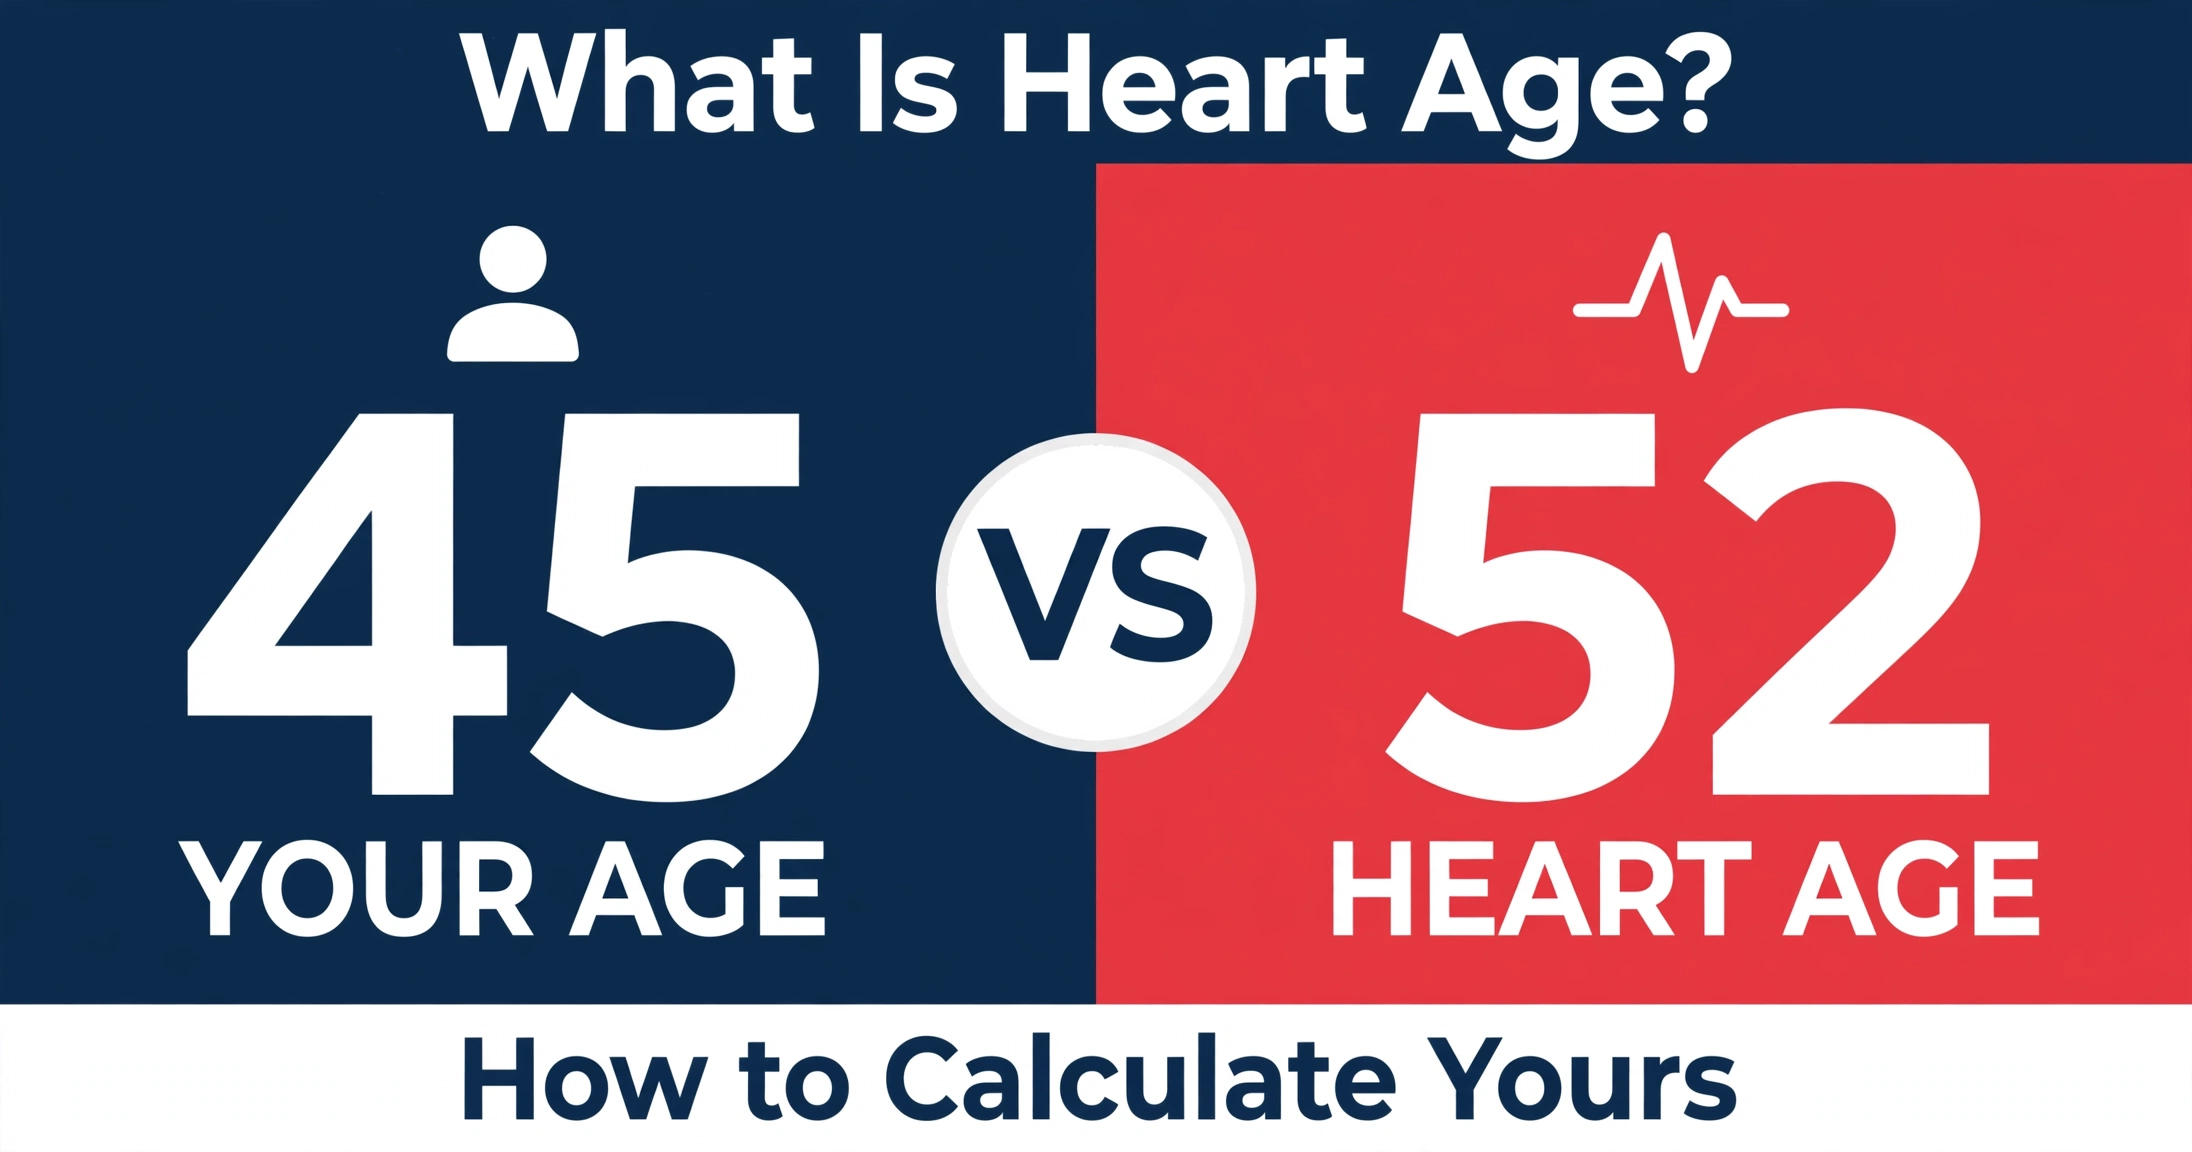
Heart age compares your biological cardiovascular risk to the average person your age. Discover evidence-based methods to understand your score and bridge the gap.

Two of the most widely used cardiovascular risk models compared: cohort populations, endpoints, calibration strengths, and clinical limitations.
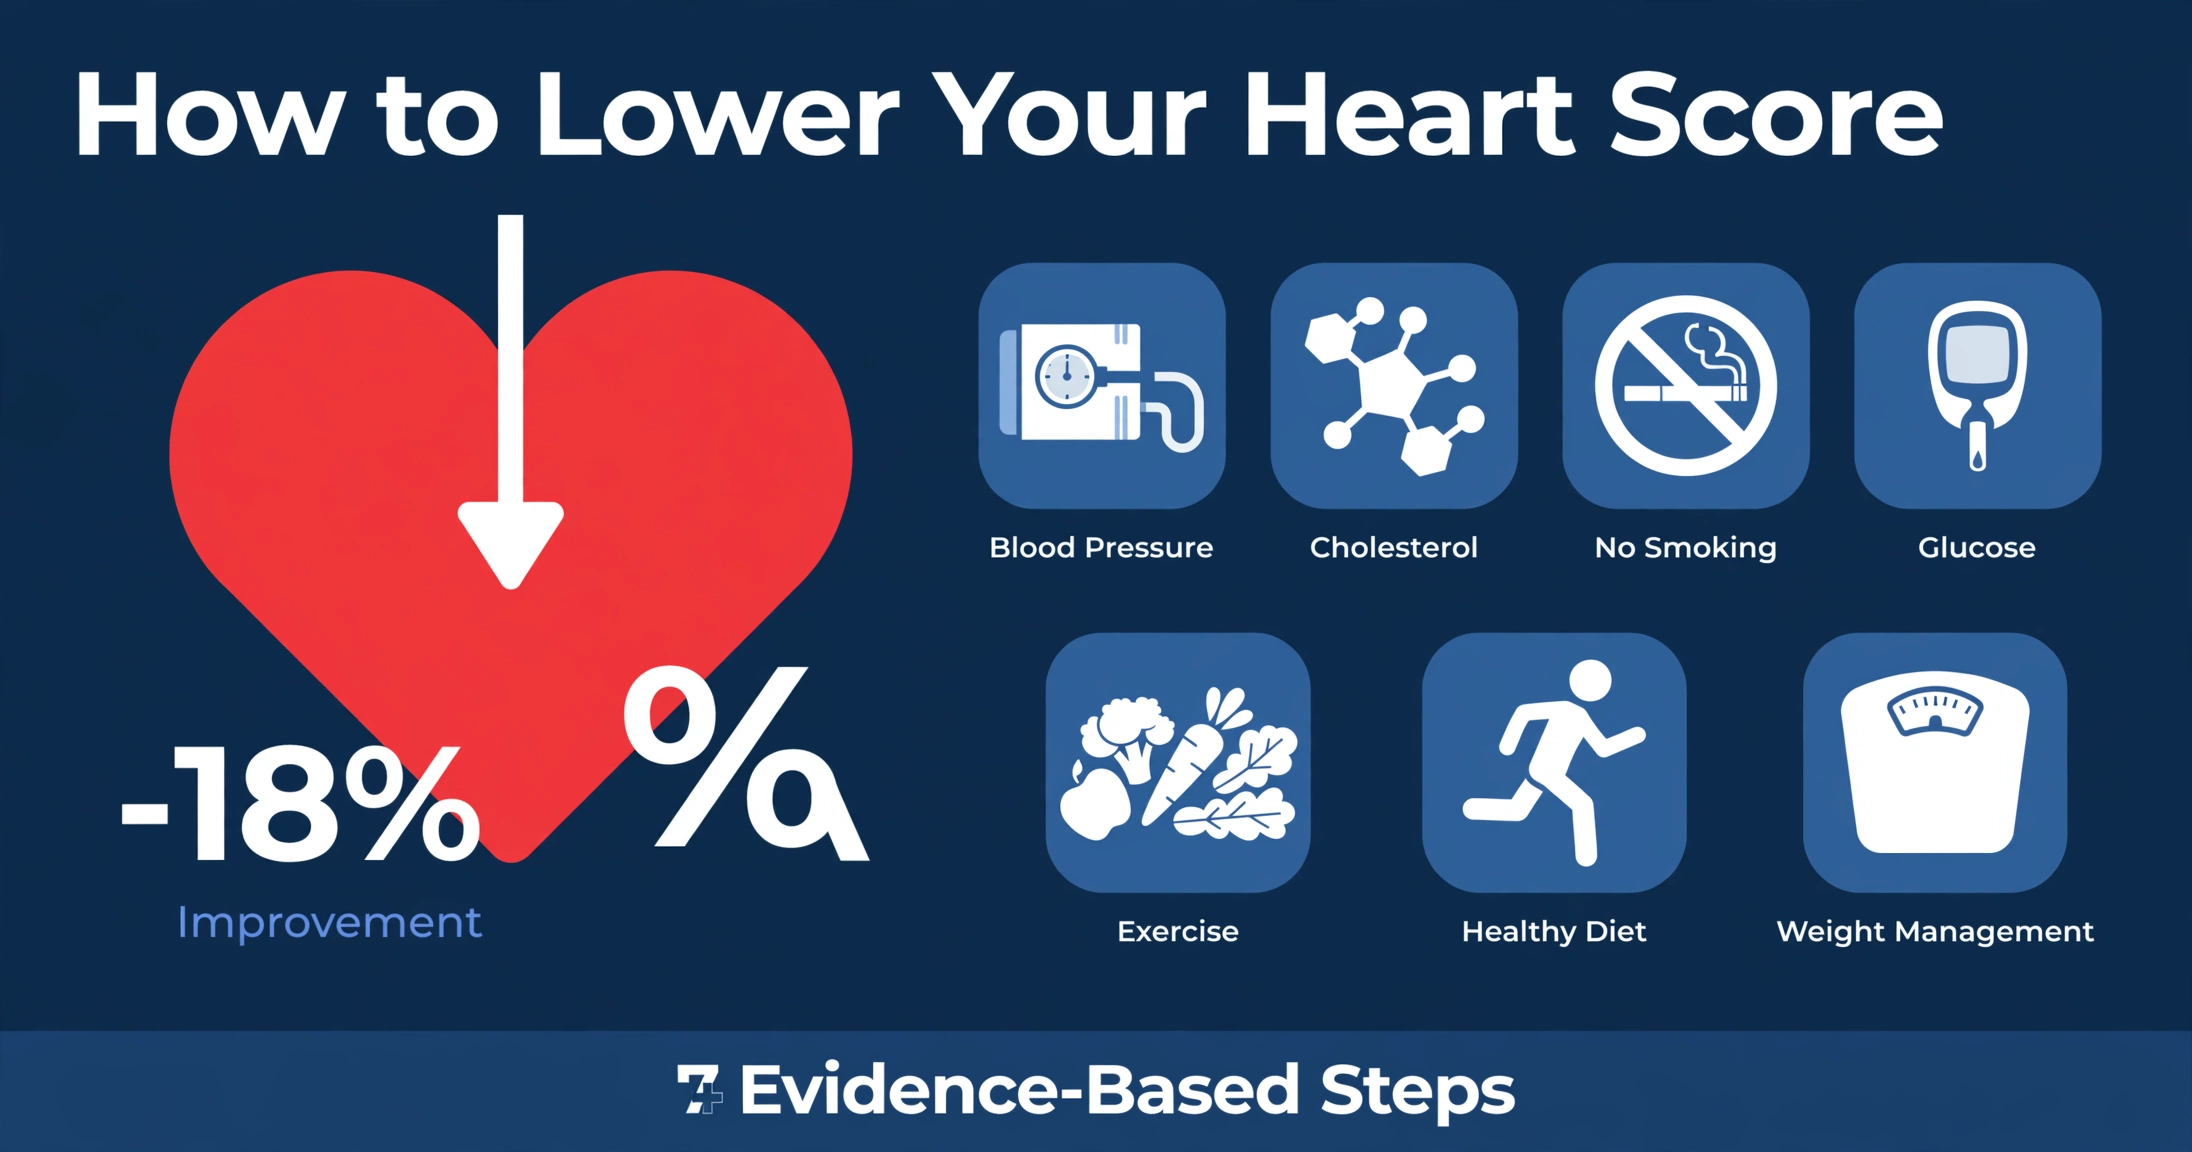
Seven interventions supported by clinical trial evidence that can directly improve the modifiable risk factors driving your heart score calculation.
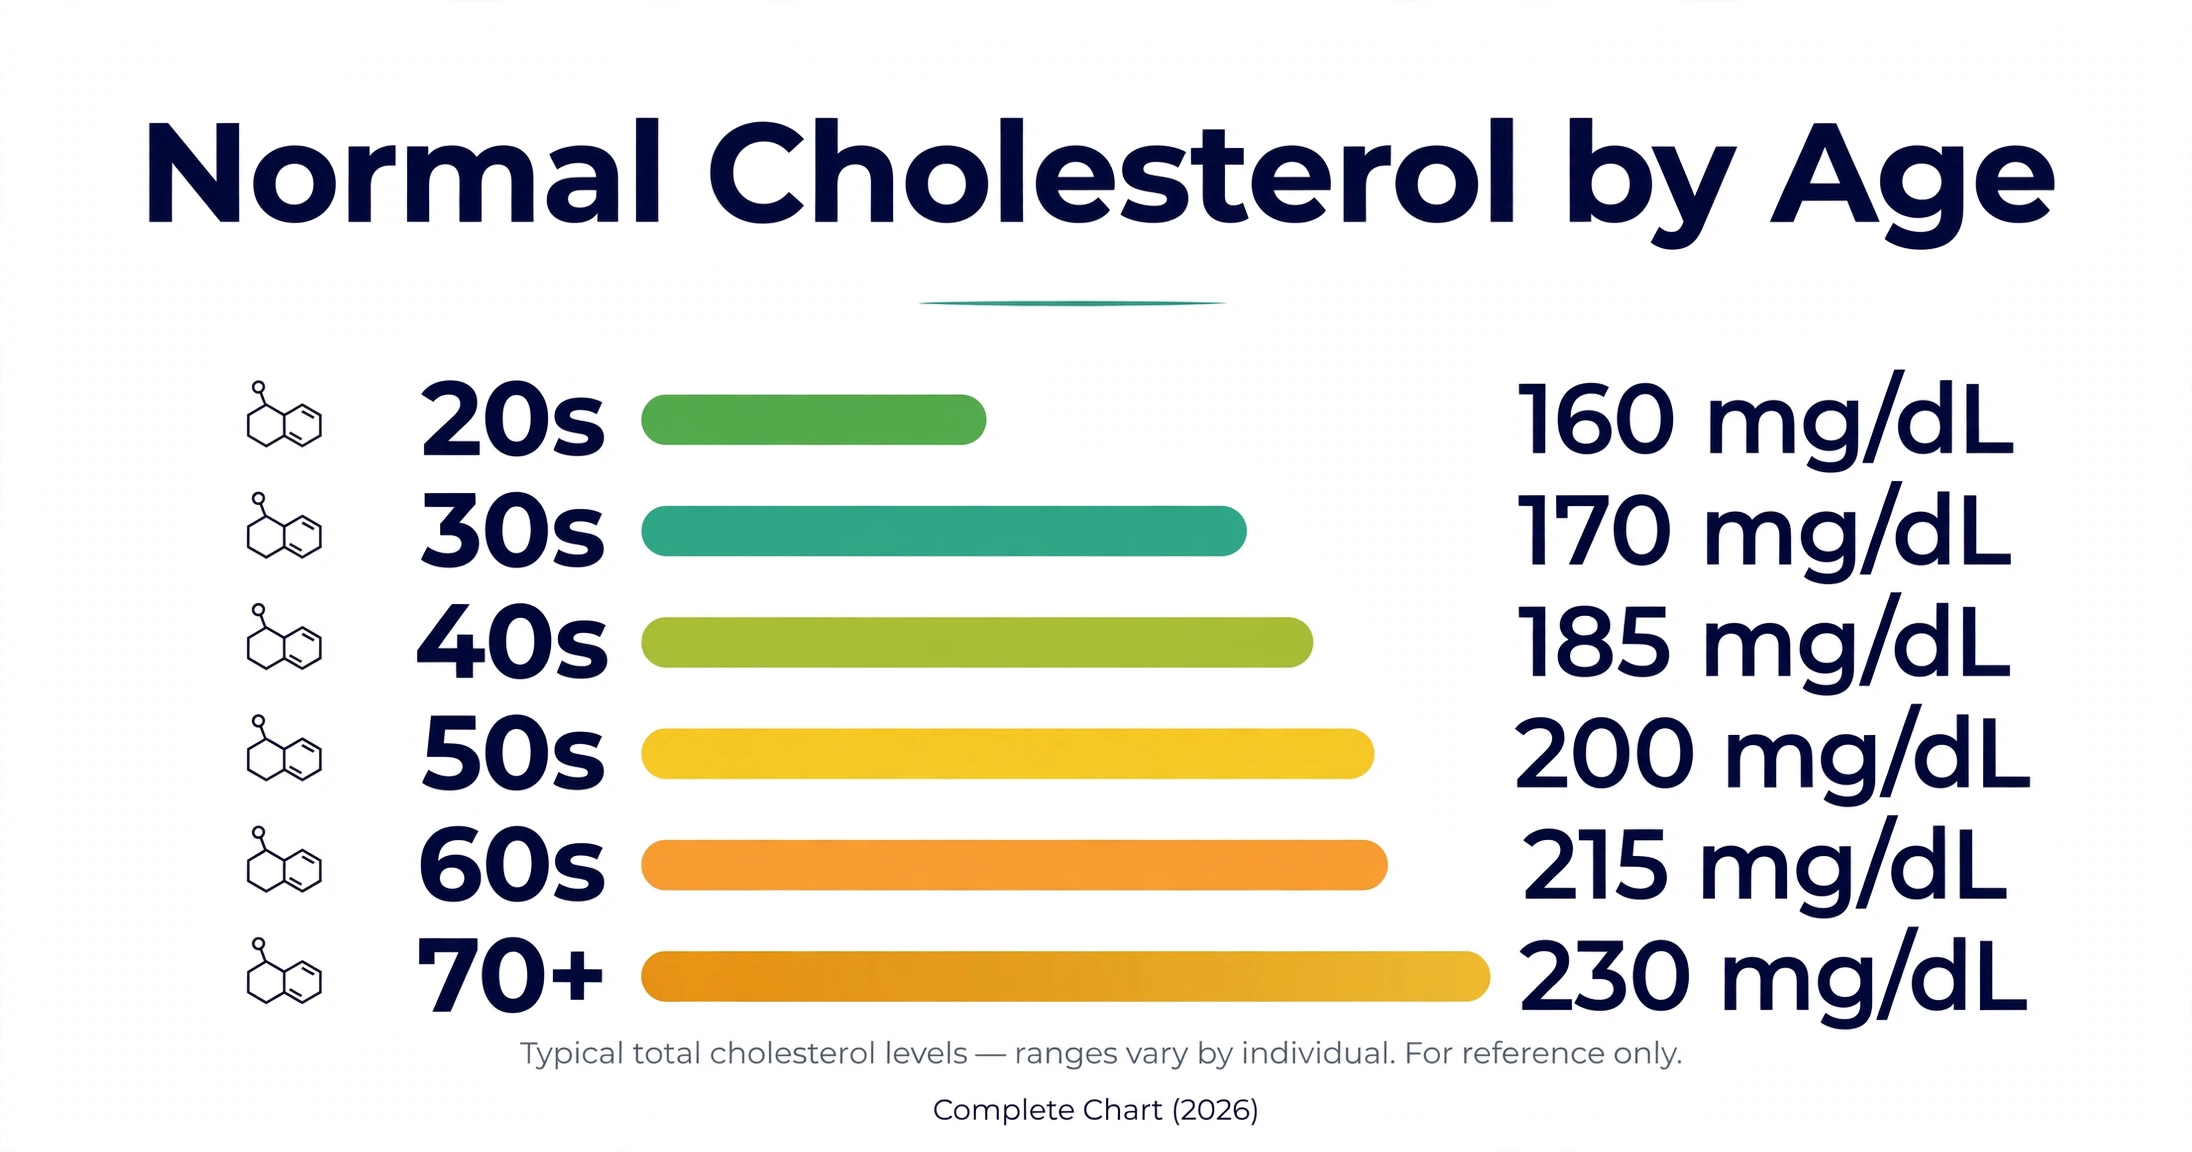
Cholesterol targets shift across different decades of life. Review clinical benchmark charts for total cholesterol, LDL, HDL, and triglycerides.
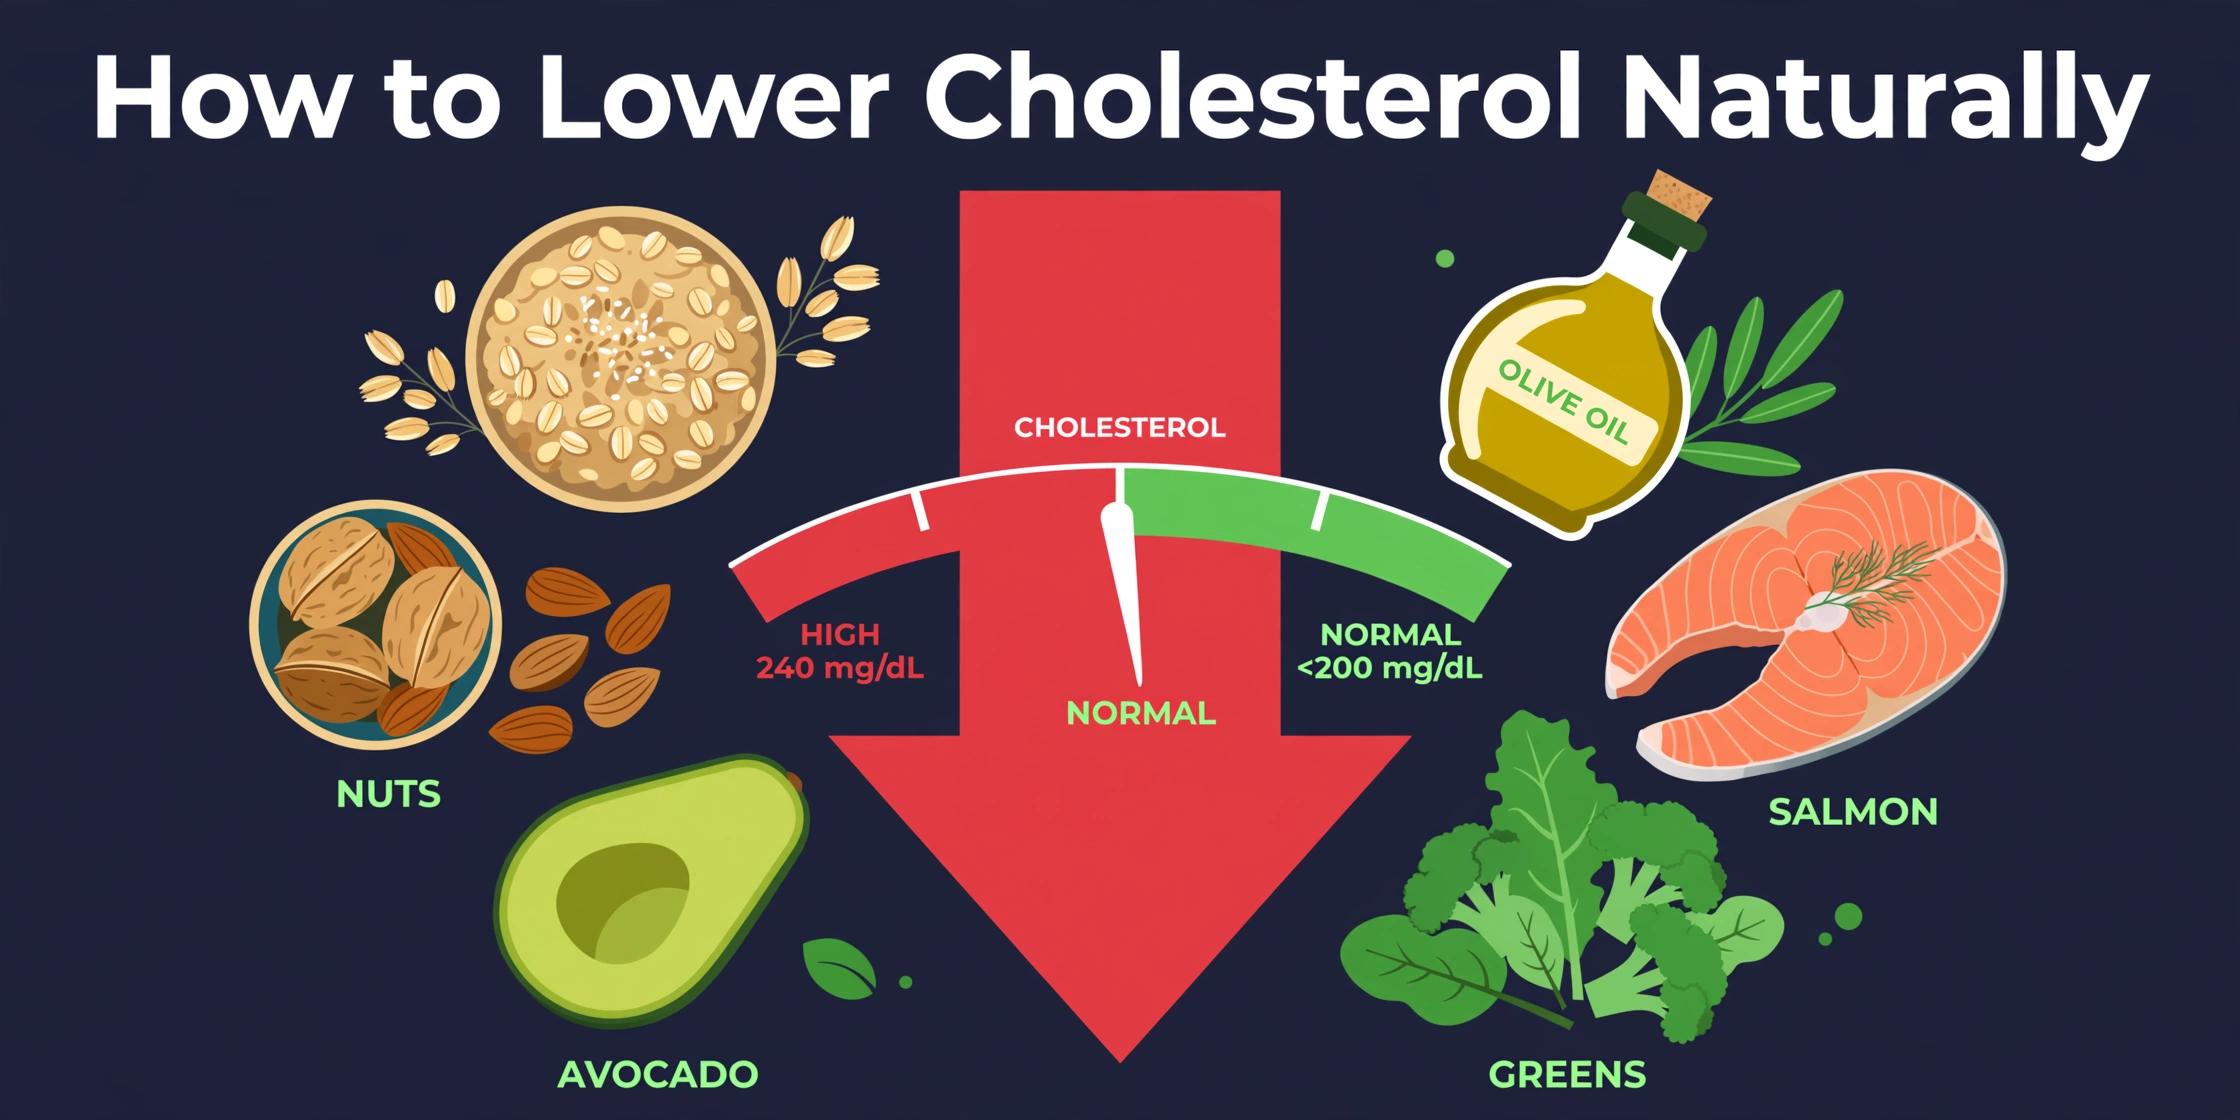
Diet, soluble fiber, plant sterols, and aerobic exercise with clinical evidence for LDL reduction, ranked by expected percentage effect size.
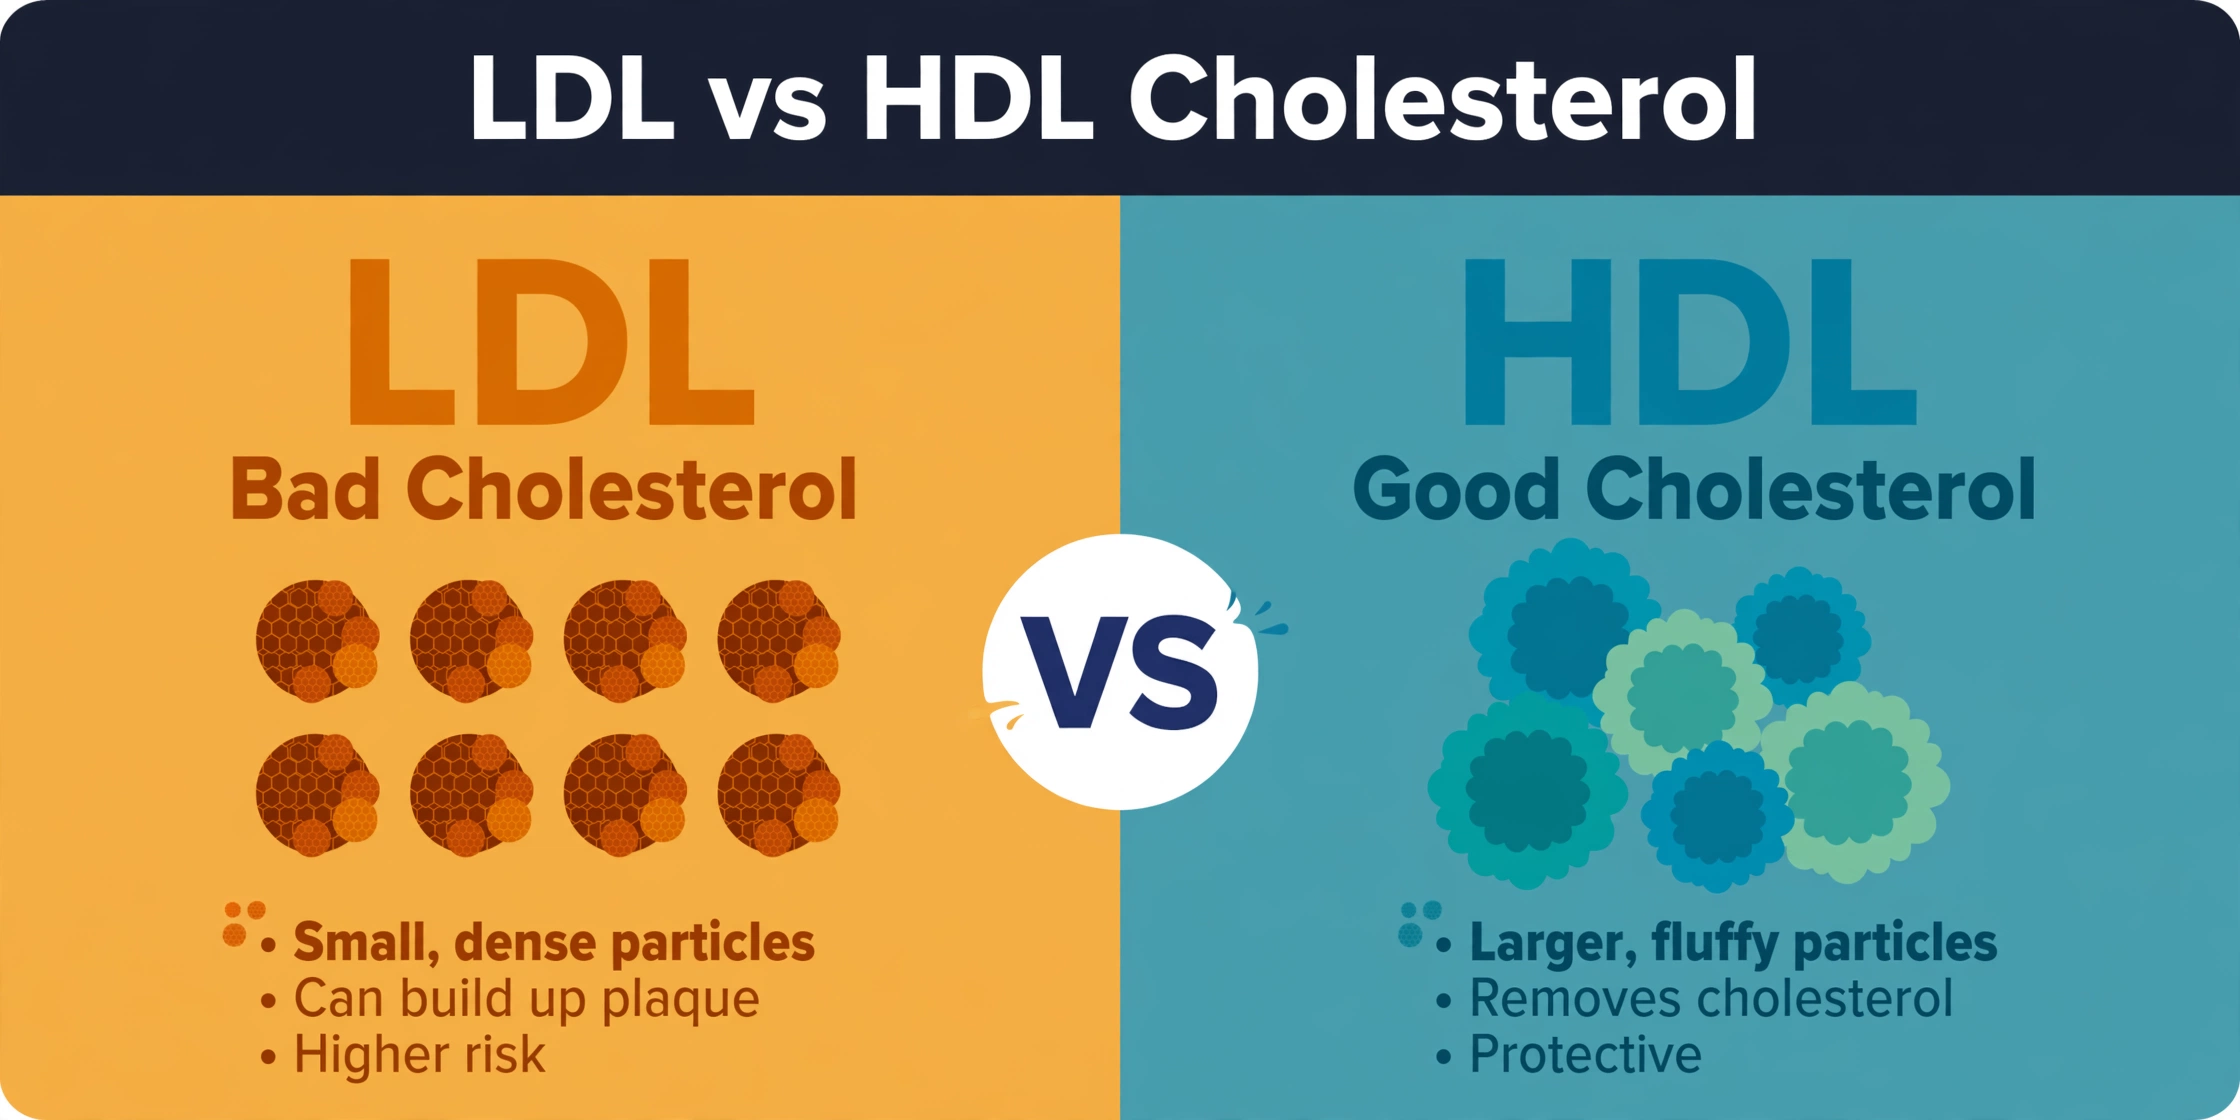
Understand the physiological differences between atherogenic LDL particles and protective HDL, optimal target ranges, and the ratios clinicians monitor.
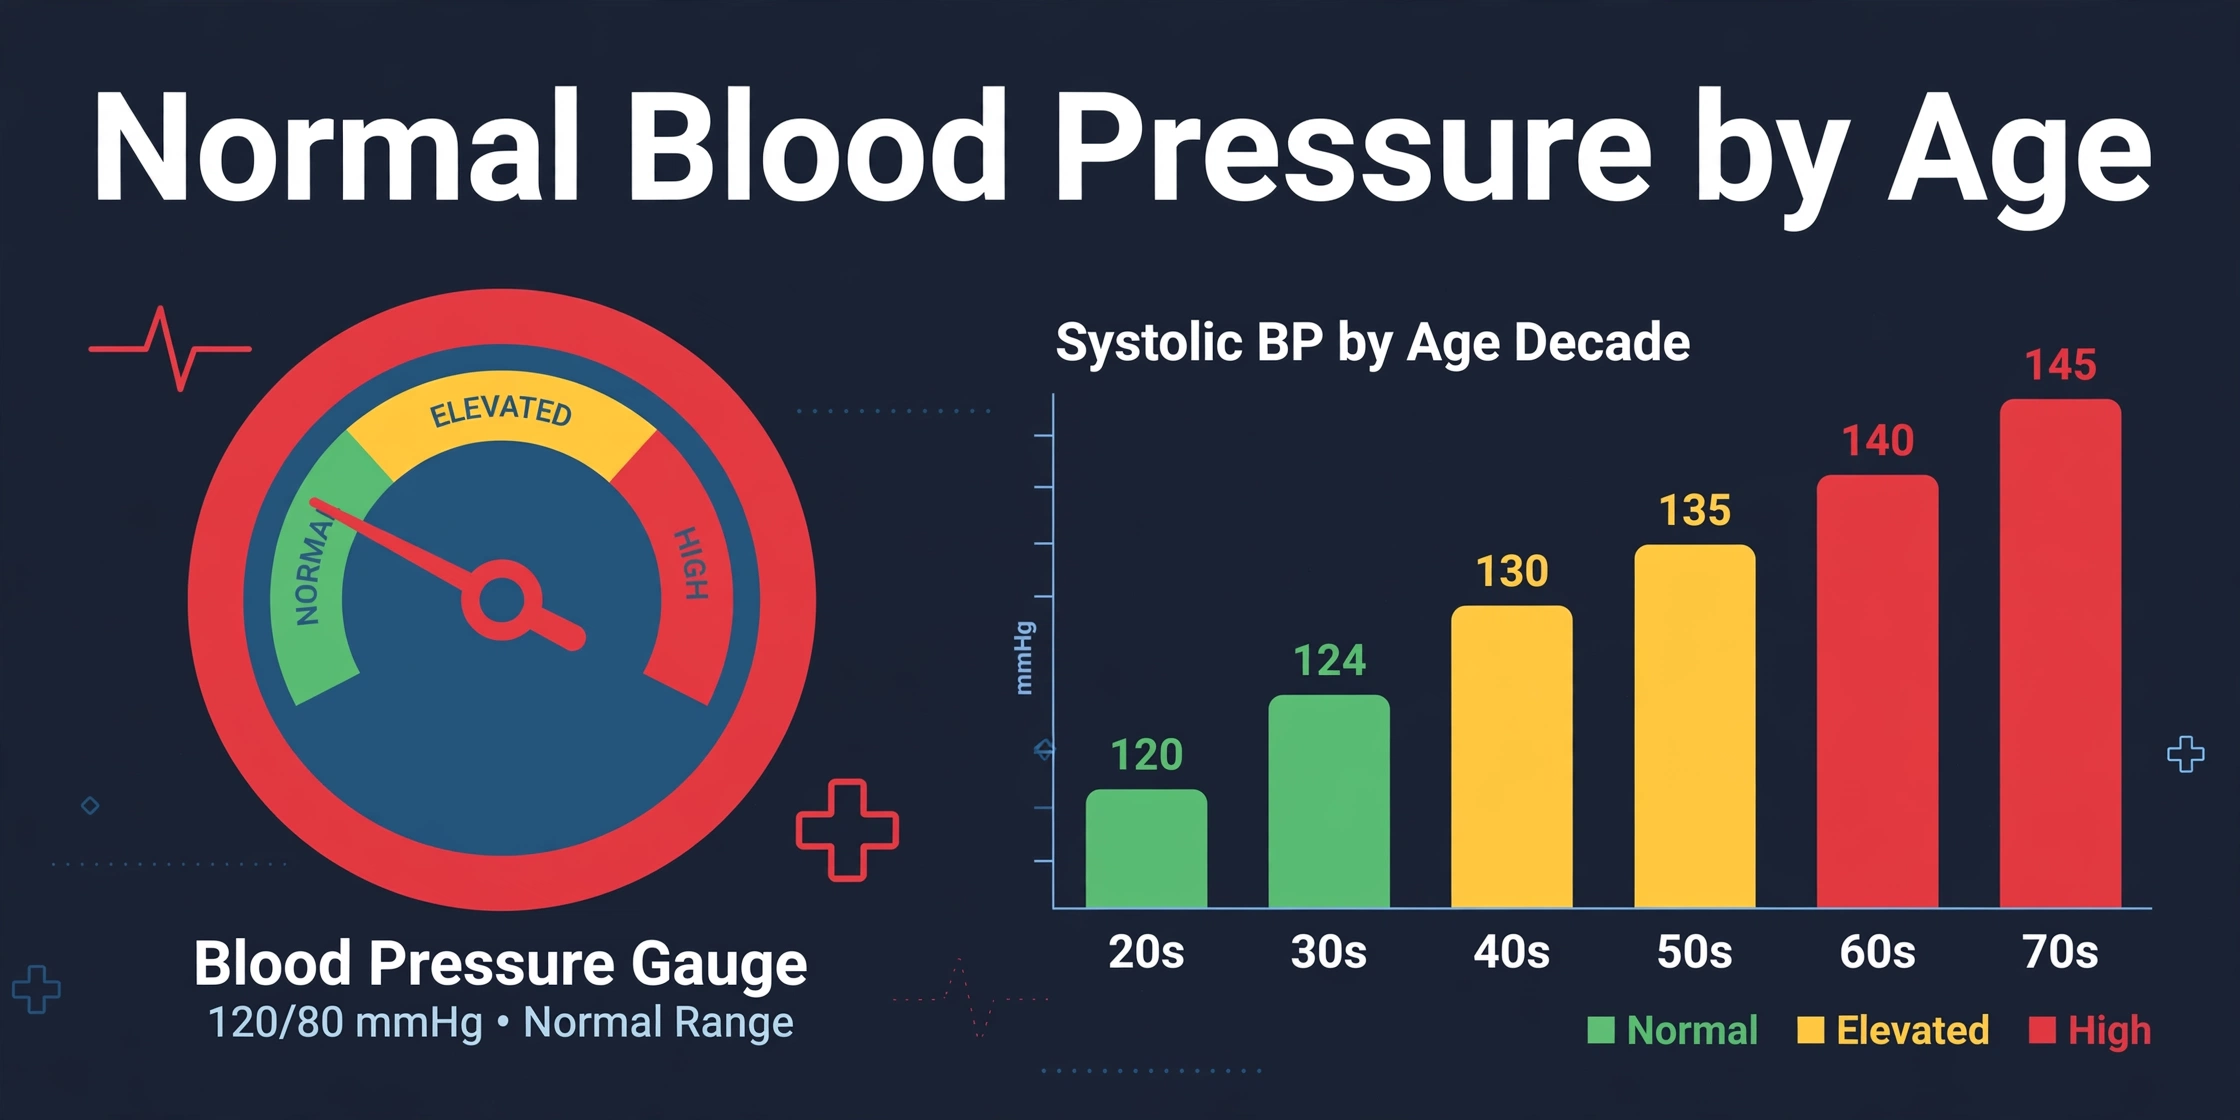
The 2017 ACC/AHA guidelines eliminated age-adjusted targets. Review why 120/80 mm Hg remains the standard and how vascular stiffening affects systolic pressure.
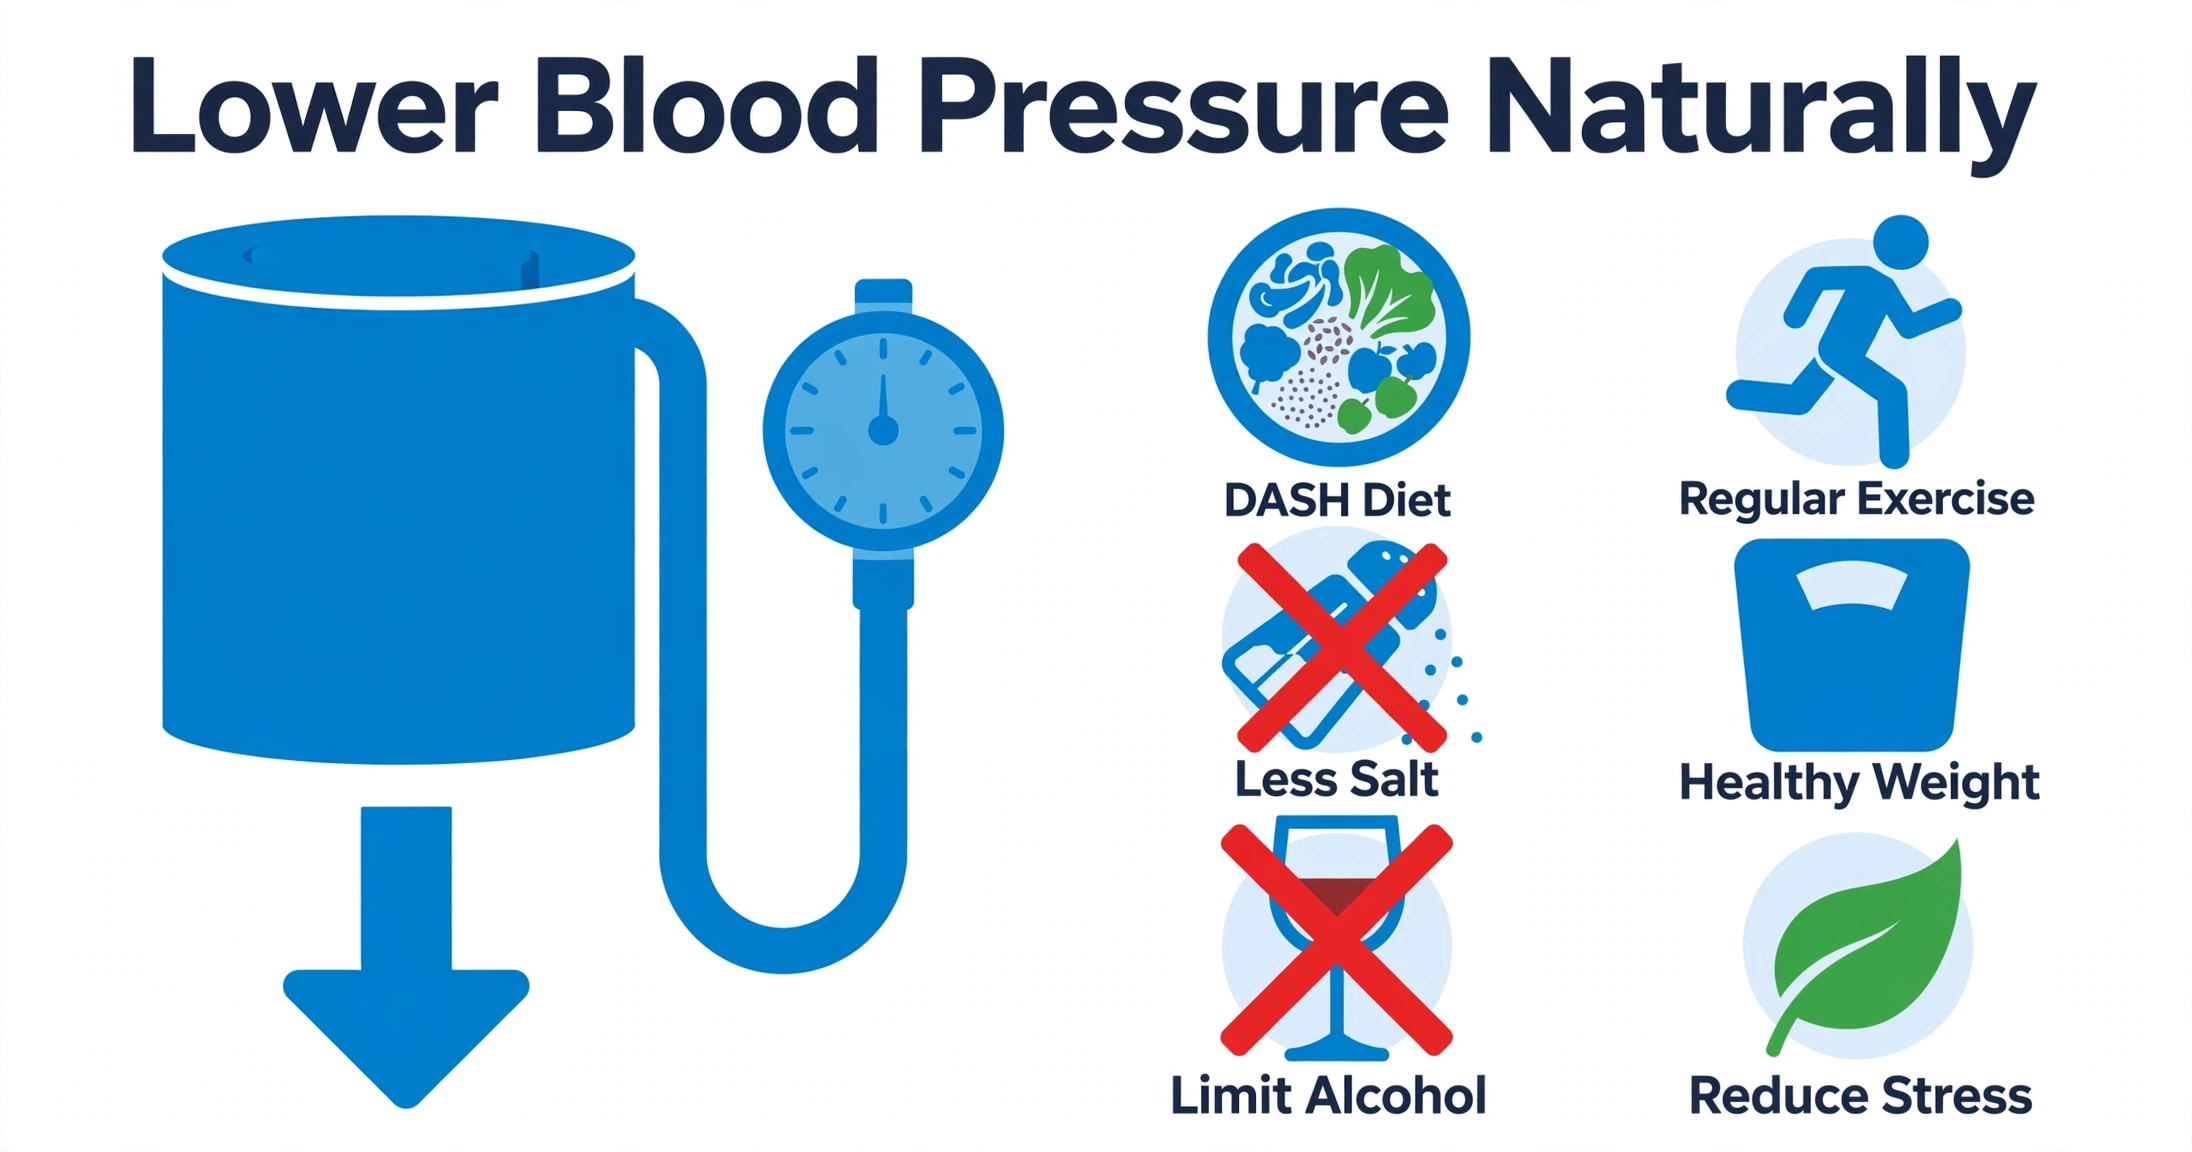
The DASH dietary pattern, sodium restriction, potassium intake, and exercise protocols that deliver clinically validated reductions in systolic mm Hg.
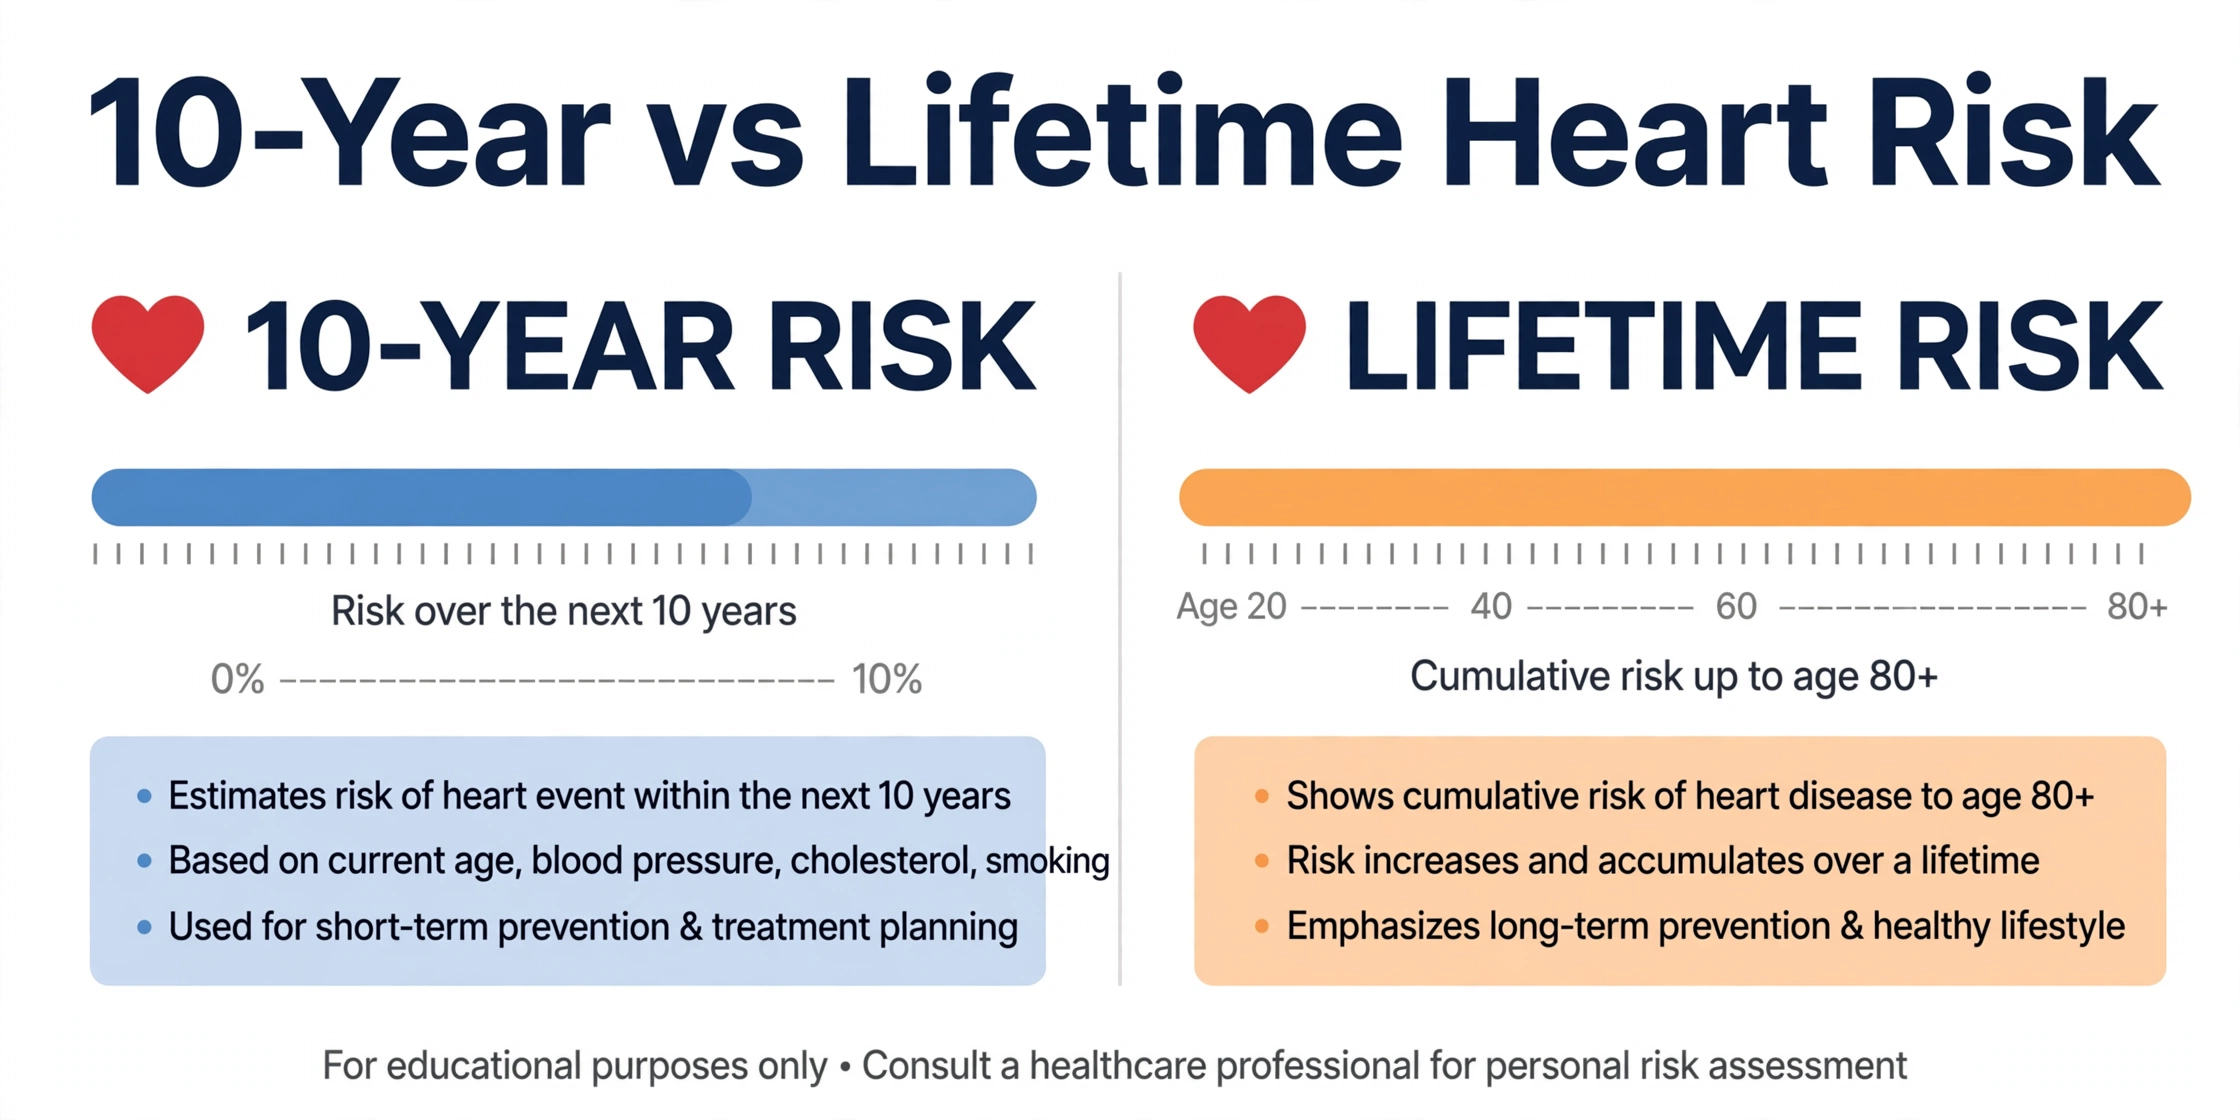
Why young adults often receive deceptively low 10-year risk scores despite high lifetime risk, and how long-term risk projections guide early preventive therapy.
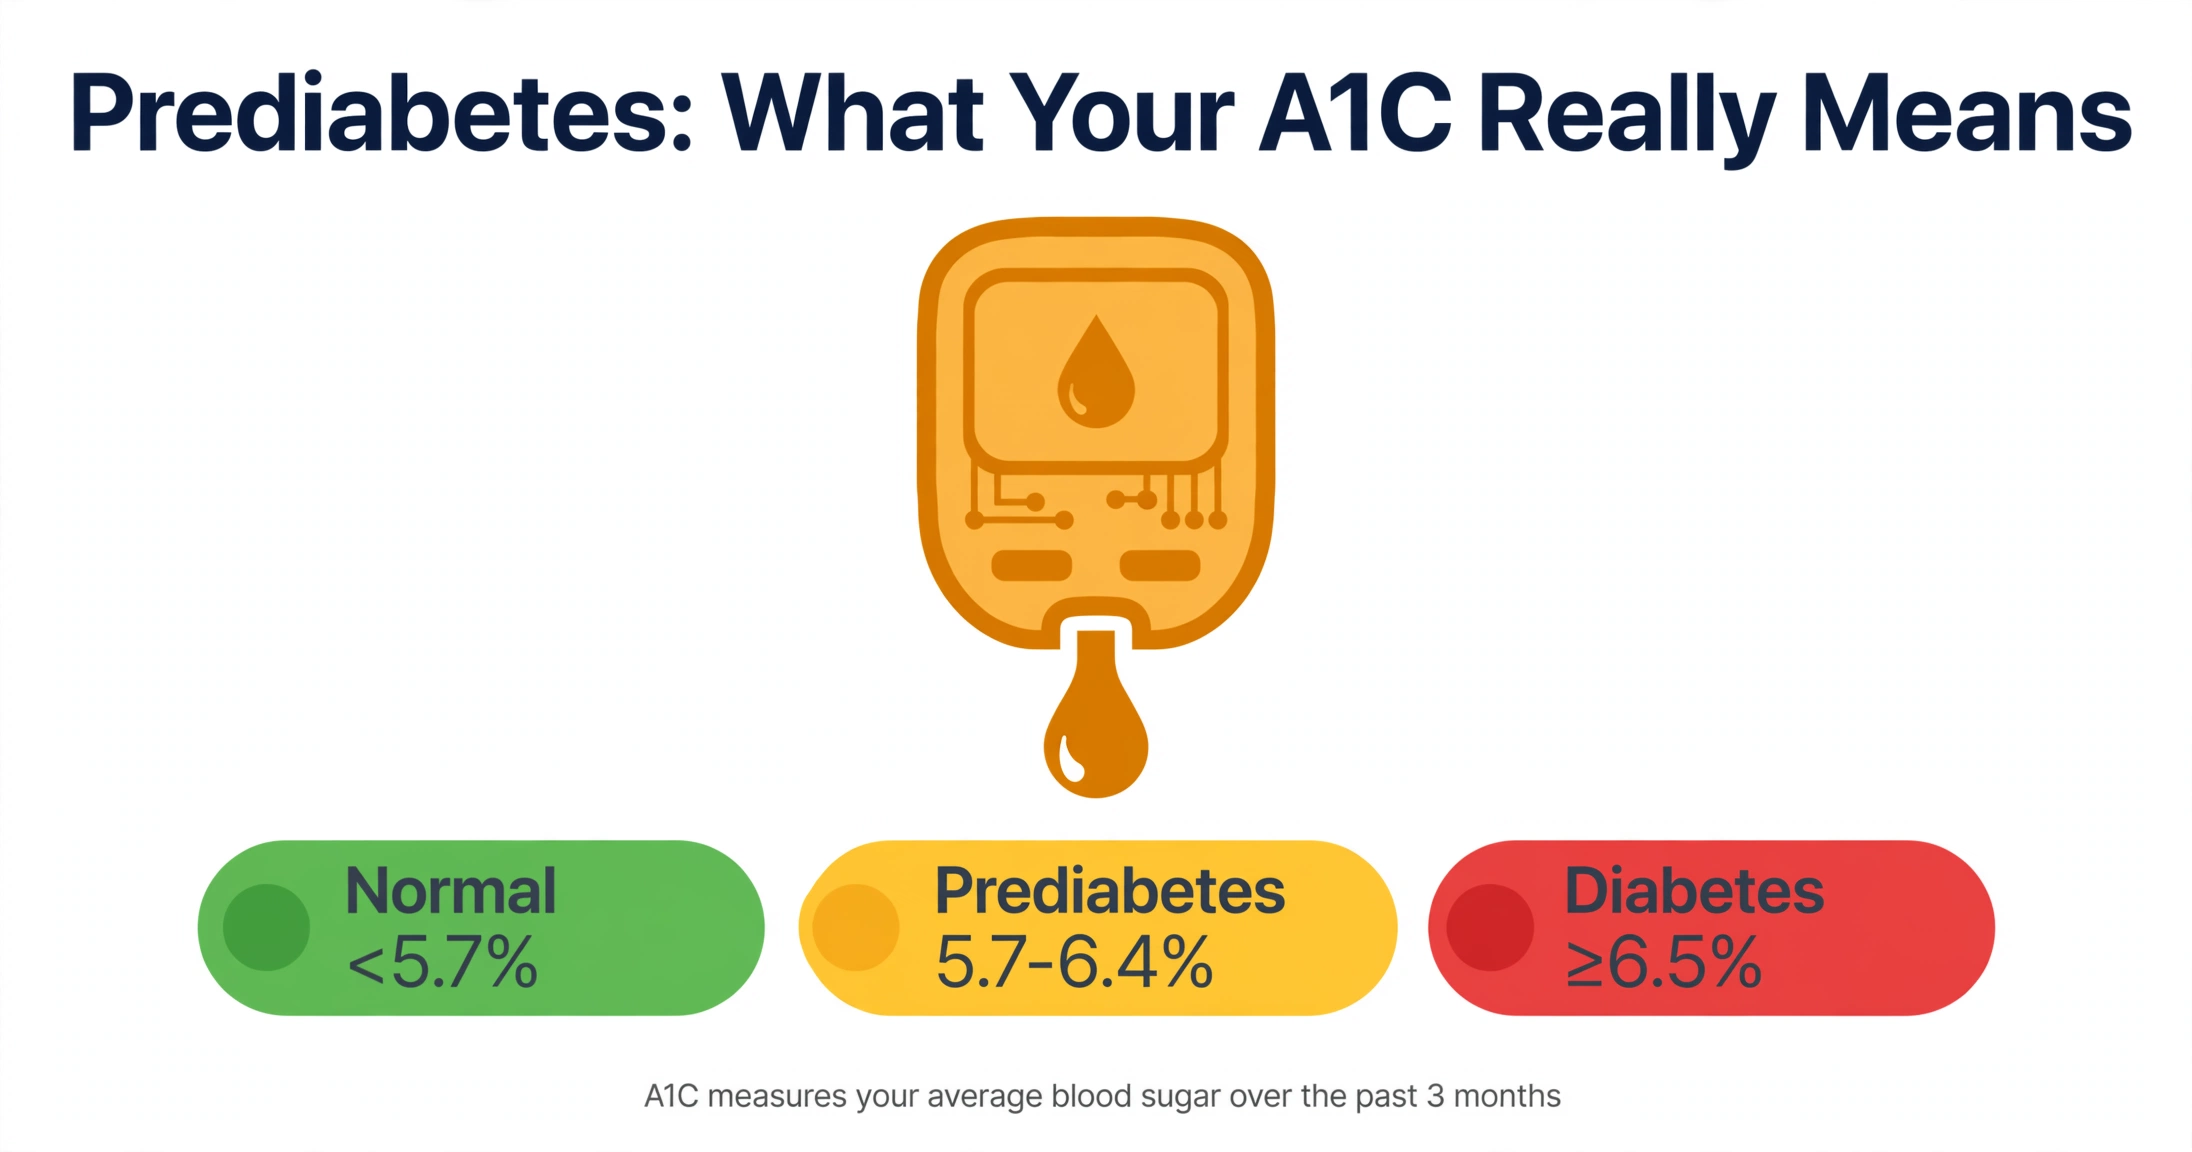
A hemoglobin A1C between 5.7% and 6.4% defines prediabetes. Understand the cardiovascular risks of insulin resistance and evidence from the Diabetes Prevention Program.
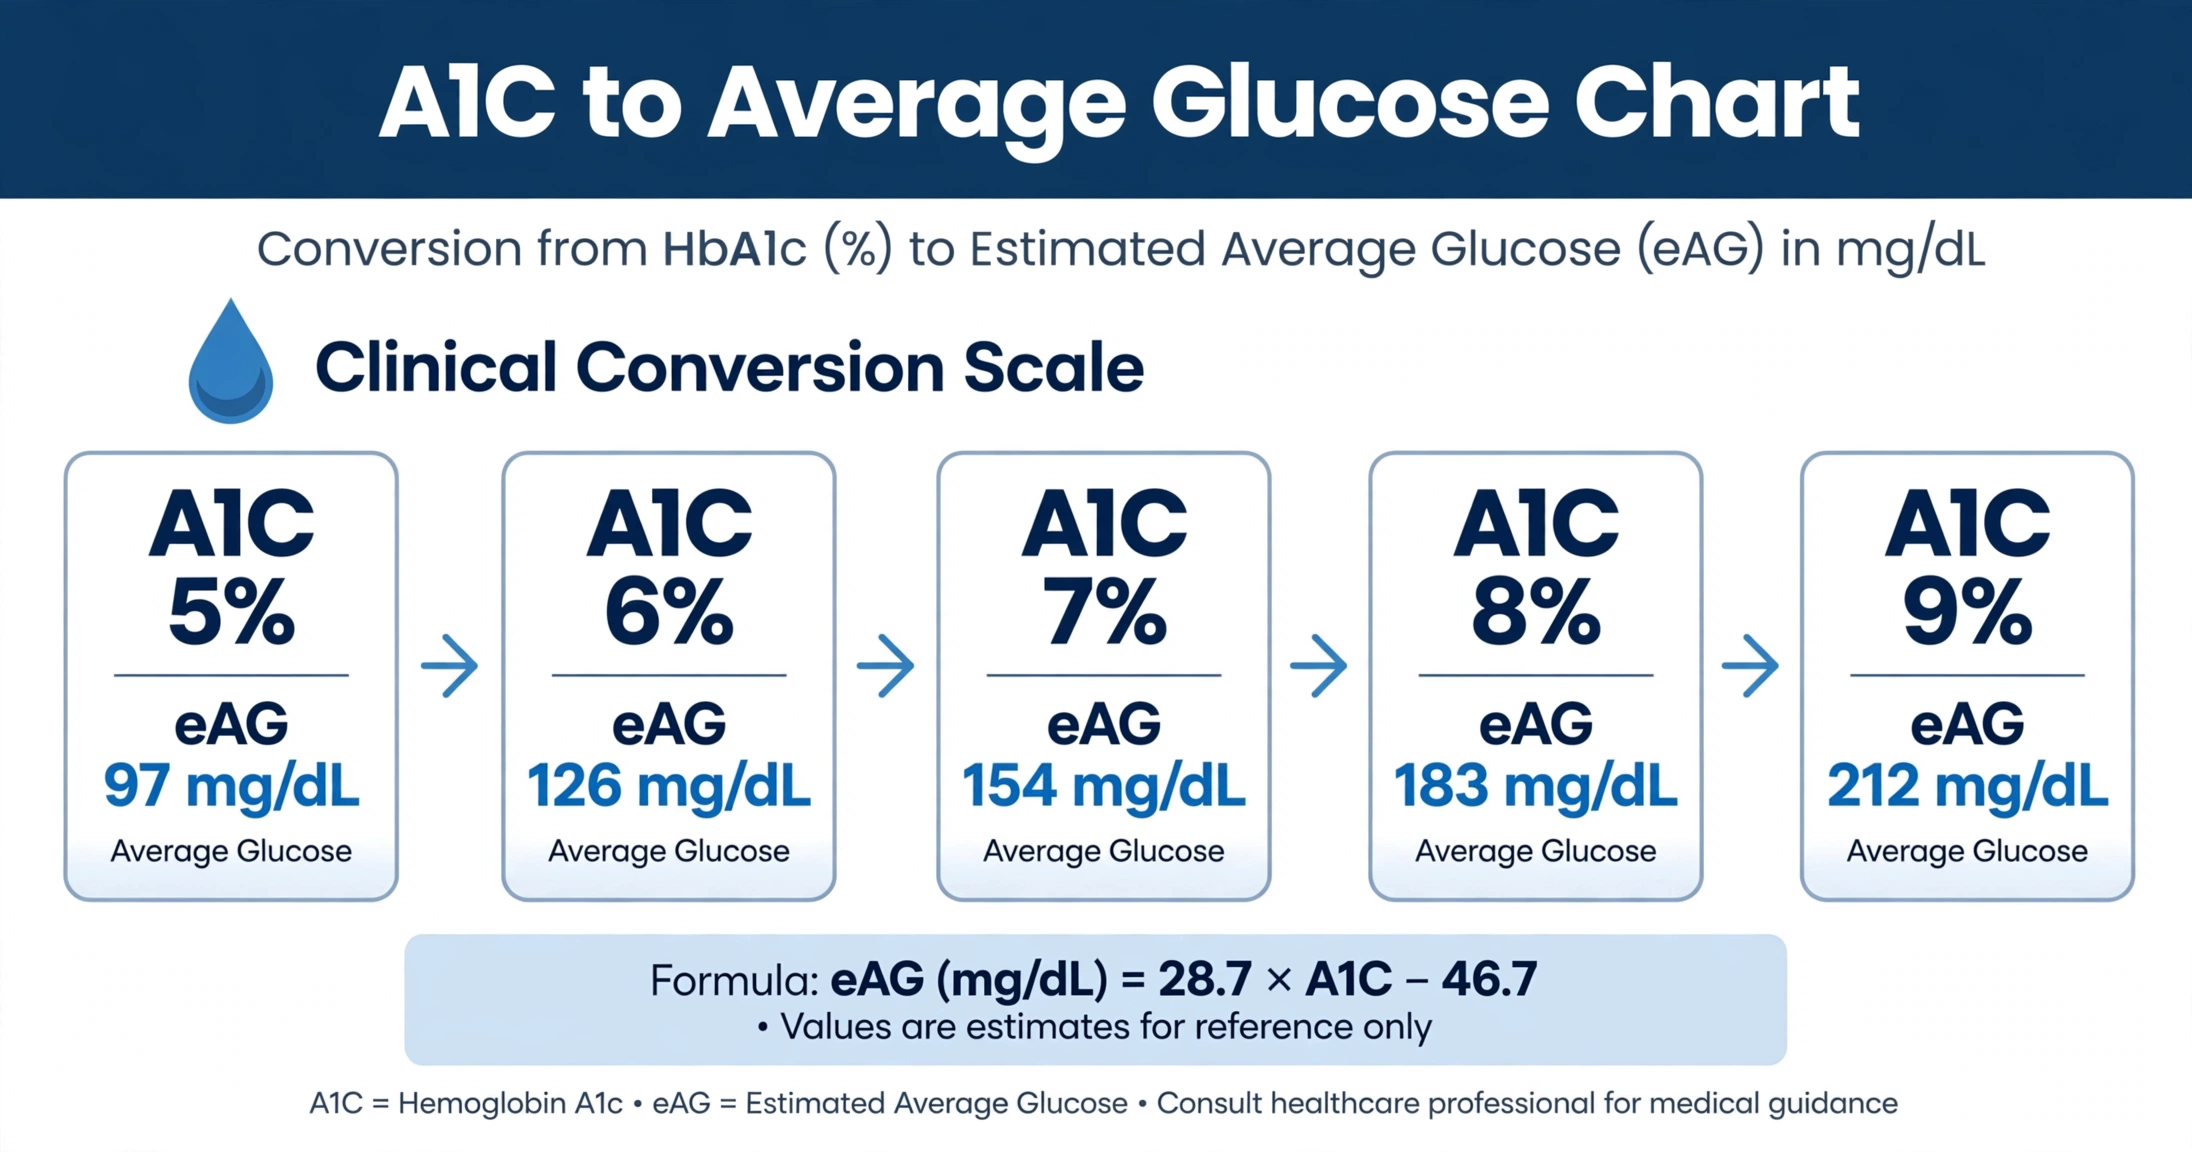
Convert your glycated hemoglobin percentage into estimated average glucose (mg/dL and mmol/L) using the validated ADAG trial mathematical formula.

Chronic kidney disease is an independent cardiovascular risk multiplier. Why the PREVENT equations now factor eGFR and UACR into heart risk calculations.
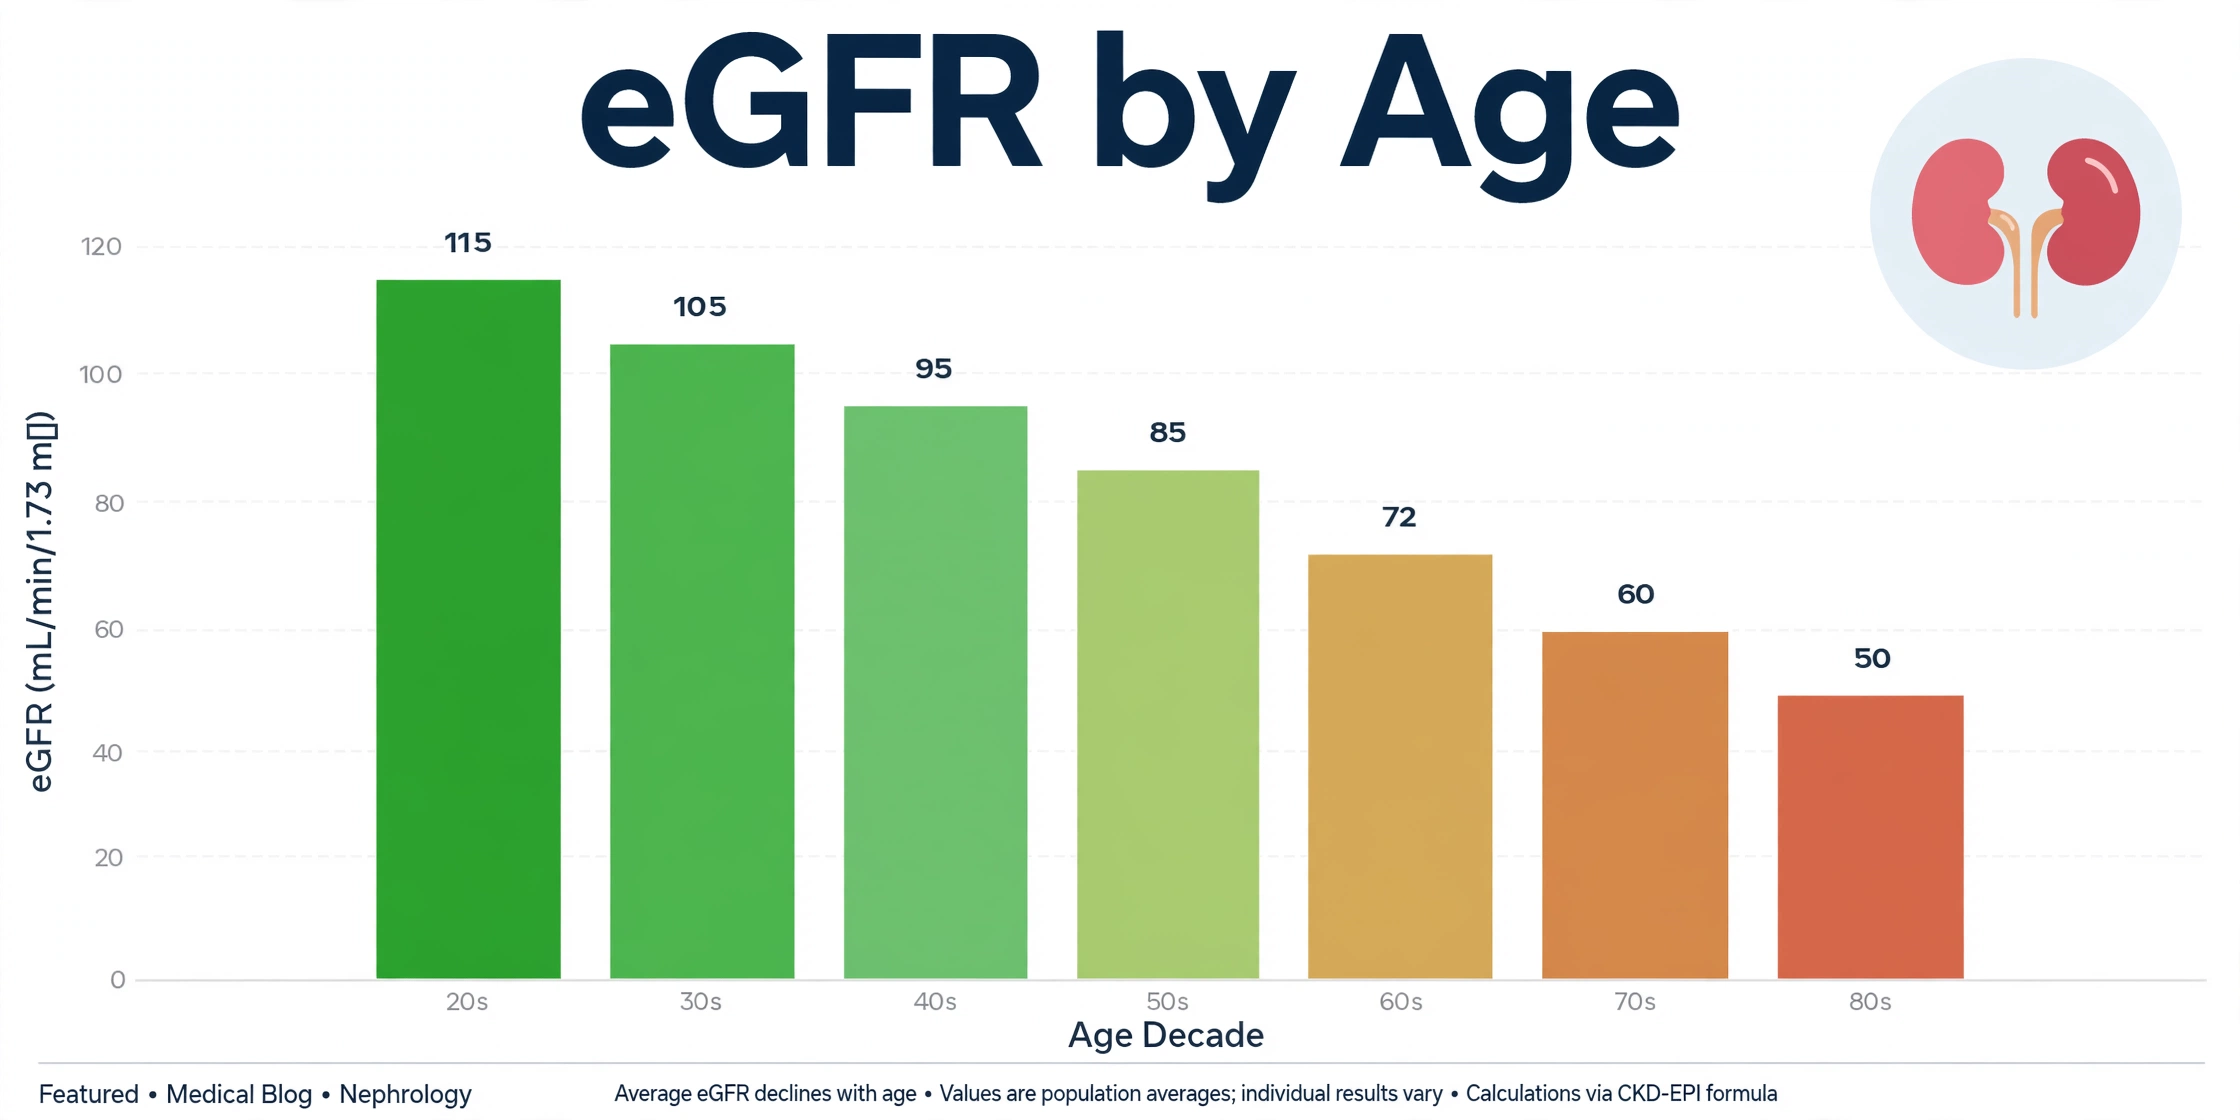
Natural age-related filtration decline versus pathological chronic kidney disease. Standard CKD staging benchmarks and interpretation guide.

A calcium score test is a low-dose CT scan that measures calcified plaque in the coronary arteries. Learn how the test works, what the CAC score chart means, and who should consider it.
Reading about clinical risk scores is essential education. Calculating your personal metrics with validated tools is the next step. Access our full library of 43+ clinical calculators for free.
🧮 Launch ASCVD Risk Estimator →