BMI Calculator:
Know Your Body
Mass Index Instantly
Enter your height, weight, and age below to calculate your Body Mass Index, ideal weight range, estimated body fat percentage, and waist-to-height ratio — all in one place. Supports metric and imperial units, with dedicated Asian BMI thresholds that most calculators ignore.
Most BMI calculators only show a number. Ours also gives you your ideal weight range, BMI Prime score, estimated body fat %, and an optional Waist-to-Height Ratio — the metric cardiologists increasingly prefer over BMI alone.
⚠️ For educational use only. BMI is a screening tool, not a diagnosis. Always consult a healthcare professional for medical guidance.
BMI Calculator
WHO FormulaResearch shows that people of Asian descent develop metabolic complications — including insulin resistance and hypertension — at lower BMI values than Western populations. This calculator applies WHO Asia-Pacific thresholds: Healthy weight ends at BMI 23.0 (not 25.0). Your result has been adjusted accordingly.
WHtR is a stronger predictor of cardiovascular risk than BMI. Enter your waist measurement below (measure at the narrowest point, halfway between bottom rib and hip bone).
Healthy target: <0.50 (most adults) · <0.46 (Asian populations) · Source: Ashwell et al., 2012
BMI is a screening tool, not a diagnosis. It cannot measure body fat directly and may misclassify athletes (high muscle mass) or elderly individuals (low muscle mass). Use it as a starting point — not a final verdict.
BMI Chart: WHO Classification for Adults
The World Health Organization defines the following BMI ranges for adults aged 18 and over. These are the same thresholds applied by the CDC, NHS, and most national health bodies worldwide. Note that separate, lower thresholds apply to people of Asian descent — see the section below.
| Category | BMI Range (kg/m²) | Asian BMI Range | Health Risk |
|---|---|---|---|
| Underweight | < 18.5 | < 18.5 | Increased (malnutrition, bone loss) |
| Healthy Weight | 18.5 – 24.9 | 18.5 – 22.9 | Lowest risk |
| Overweight | 25.0 – 29.9 | 23.0 – 27.4 | Increased (moderate) |
| Obese Class I | 30.0 – 34.9 | 27.5 – 32.4 | High |
| Obese Class II | 35.0 – 39.9 | 32.5 – 37.4 | Very High |
| Obese Class III | ≥ 40.0 | ≥ 37.5 | Extremely High |
Why are Asian BMI thresholds lower? Studies across multiple Asian populations show that metabolic complications — including insulin resistance, type 2 diabetes, and cardiovascular disease — begin emerging at a BMI of around 23.0, rather than 25.0. This occurs because Asian individuals tend to carry a higher proportion of visceral (organ) fat at any given BMI compared to people of European descent. The WHO issued formal Asia-Pacific guidelines recommending these lower cut-offs.
BMI vs. Waist-to-Height Ratio: Which Is Better?
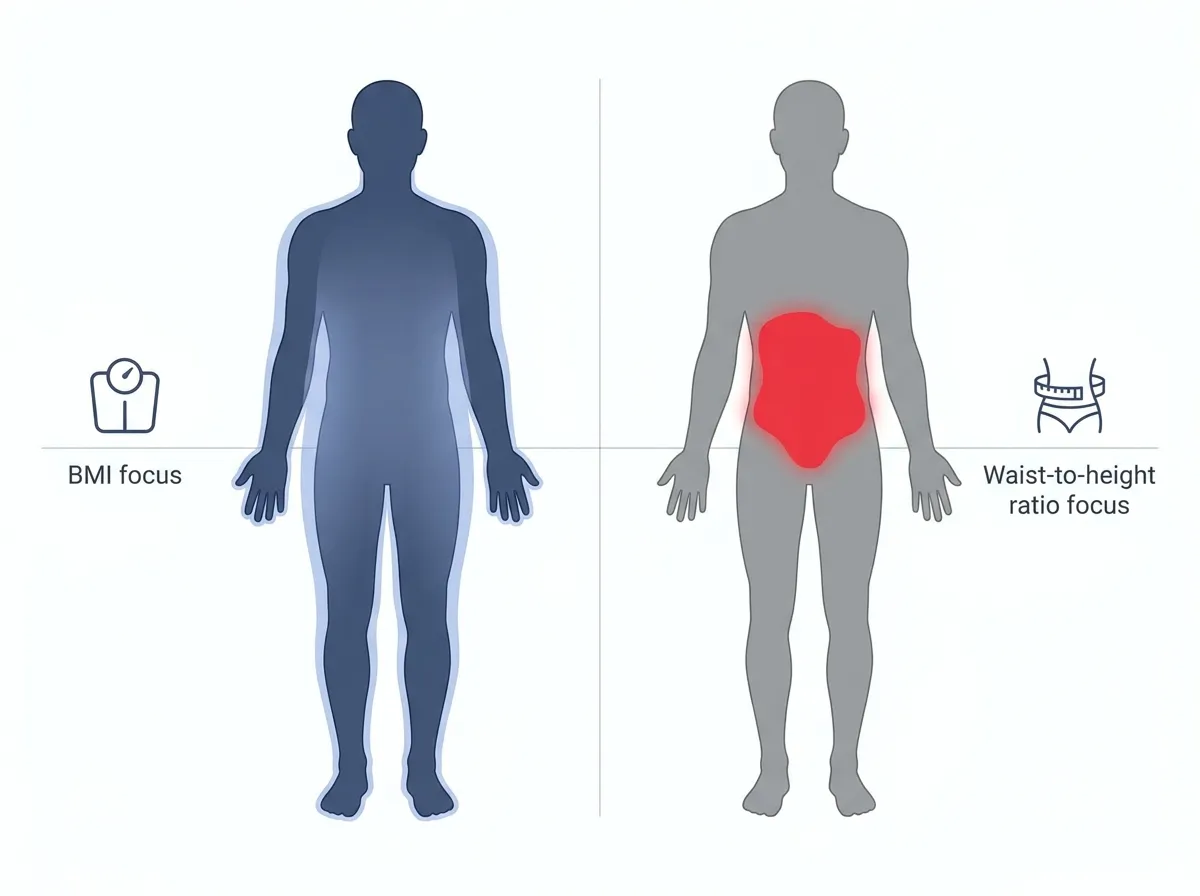
BMI has been the default measure of body weight status for decades, but it has well-documented blind spots. Waist-to-Height Ratio (WHtR) has emerged as a complementary metric that directly captures central obesity — the accumulation of fat around the abdomen and internal organs that drives cardiovascular risk independently of total body weight.
| Feature | BMI | Waist-to-Height Ratio |
|---|---|---|
| Measures central (abdominal) fat | ✗ No | ✓ Yes |
| Distinguishes muscle from fat | ✗ No | ⚠ Partially |
| Predicts heart disease risk | ⚠ Moderate | ✓ Strong |
| Works across ethnicities | ⚠ With adjustments | ✓ Better |
| Easy to measure at home | ✓ Yes | ✓ Yes |
| Used in clinical guidelines | ✓ Widely | ⚠ Growing |
The recommended WHtR target is below 0.5 for most adults — meaning your waist circumference should be less than half your height. Research by Ashwell et al. (2012) found that a WHtR above 0.5 predicted metabolic risk with greater accuracy than BMI in both men and women across multiple ethnic groups. For people of Asian descent, a more conservative threshold of below 0.46 is often recommended.
What BMI Cannot Tell You
Understanding BMI's limitations helps you use it correctly — as one data point among several, not as a definitive verdict on your health.
BMI measures total weight relative to height. A competitive athlete with dense muscle tissue can register an "overweight" BMI while carrying very low body fat. Conversely, a sedentary person with low muscle mass may have a "normal" BMI while still carrying dangerous levels of fat.
Where fat is stored matters as much as how much fat you carry. Visceral fat — stored around the liver, heart, and other organs — is far more metabolically dangerous than subcutaneous fat stored under the skin. BMI gives no information about fat location.
As people age, muscle mass naturally decreases and is often replaced by fat — even when total weight stays constant. A 65-year-old with a "normal" BMI of 23 may have significantly more body fat than a 25-year-old with the same score.
Metabolic risk varies by ethnicity at the same BMI value. Asian populations carry greater health risk at lower BMI values, while some studies suggest BMI overestimates obesity risk in Black populations due to differences in bone density and muscle mass distribution.
For a complete picture of body composition and metabolic risk, clinicians increasingly combine BMI with waist circumference, waist-to-height ratio, and fasting blood glucose. If your BMI is borderline or you have other risk factors, request a full metabolic panel at your next check-up rather than relying on BMI alone.
Evidence-Based Ways to Reach a Healthy BMI
Reaching and maintaining a healthy BMI requires a combination of dietary adjustments, physical activity, and behavioural change. The following strategies are supported by strong clinical evidence and endorsed by leading health organisations including the WHO, NHS, and American Heart Association.
A sustainable caloric deficit of 500–750 kcal per day produces roughly 0.5–0.75 kg of fat loss per week. Focus on whole foods, adequate protein (1.2–1.6 g/kg of body weight), and minimising ultra-processed foods rather than eliminating entire food groups.
The WHO recommends at least 150–300 minutes of moderate-intensity aerobic activity per week for adults. Activities such as brisk walking, cycling, and swimming are effective at reducing overall body fat and improving cardiovascular fitness simultaneously.
Resistance training 2–3 times per week preserves lean muscle mass during weight loss — critical for maintaining metabolic rate. Muscle tissue burns approximately 3x more calories at rest than fat tissue, making it an essential component of long-term weight management.
Chronic sleep deprivation (under 6 hours per night) elevates ghrelin (hunger hormone) and suppresses leptin (satiety hormone), significantly increasing appetite and caloric intake. Prioritising 7–9 hours of quality sleep is an underappreciated but powerful weight-management strategy.
Important: Even a 5–10% reduction in body weight produces clinically meaningful improvements in blood pressure, blood glucose, cholesterol, and joint pain. Sustainable, gradual weight loss of 0.5–1 kg per week is safer and more maintainable than aggressive crash dieting.