Prediabetes: What Your A1C Really Means
An A1C between 5.7% and 6.4% falls in the prediabetes range: blood sugar is elevated but has not crossed the diabetes threshold of 6.5%. Understanding what this number reflects, how it is measured, and what the research shows can help put the result in context.
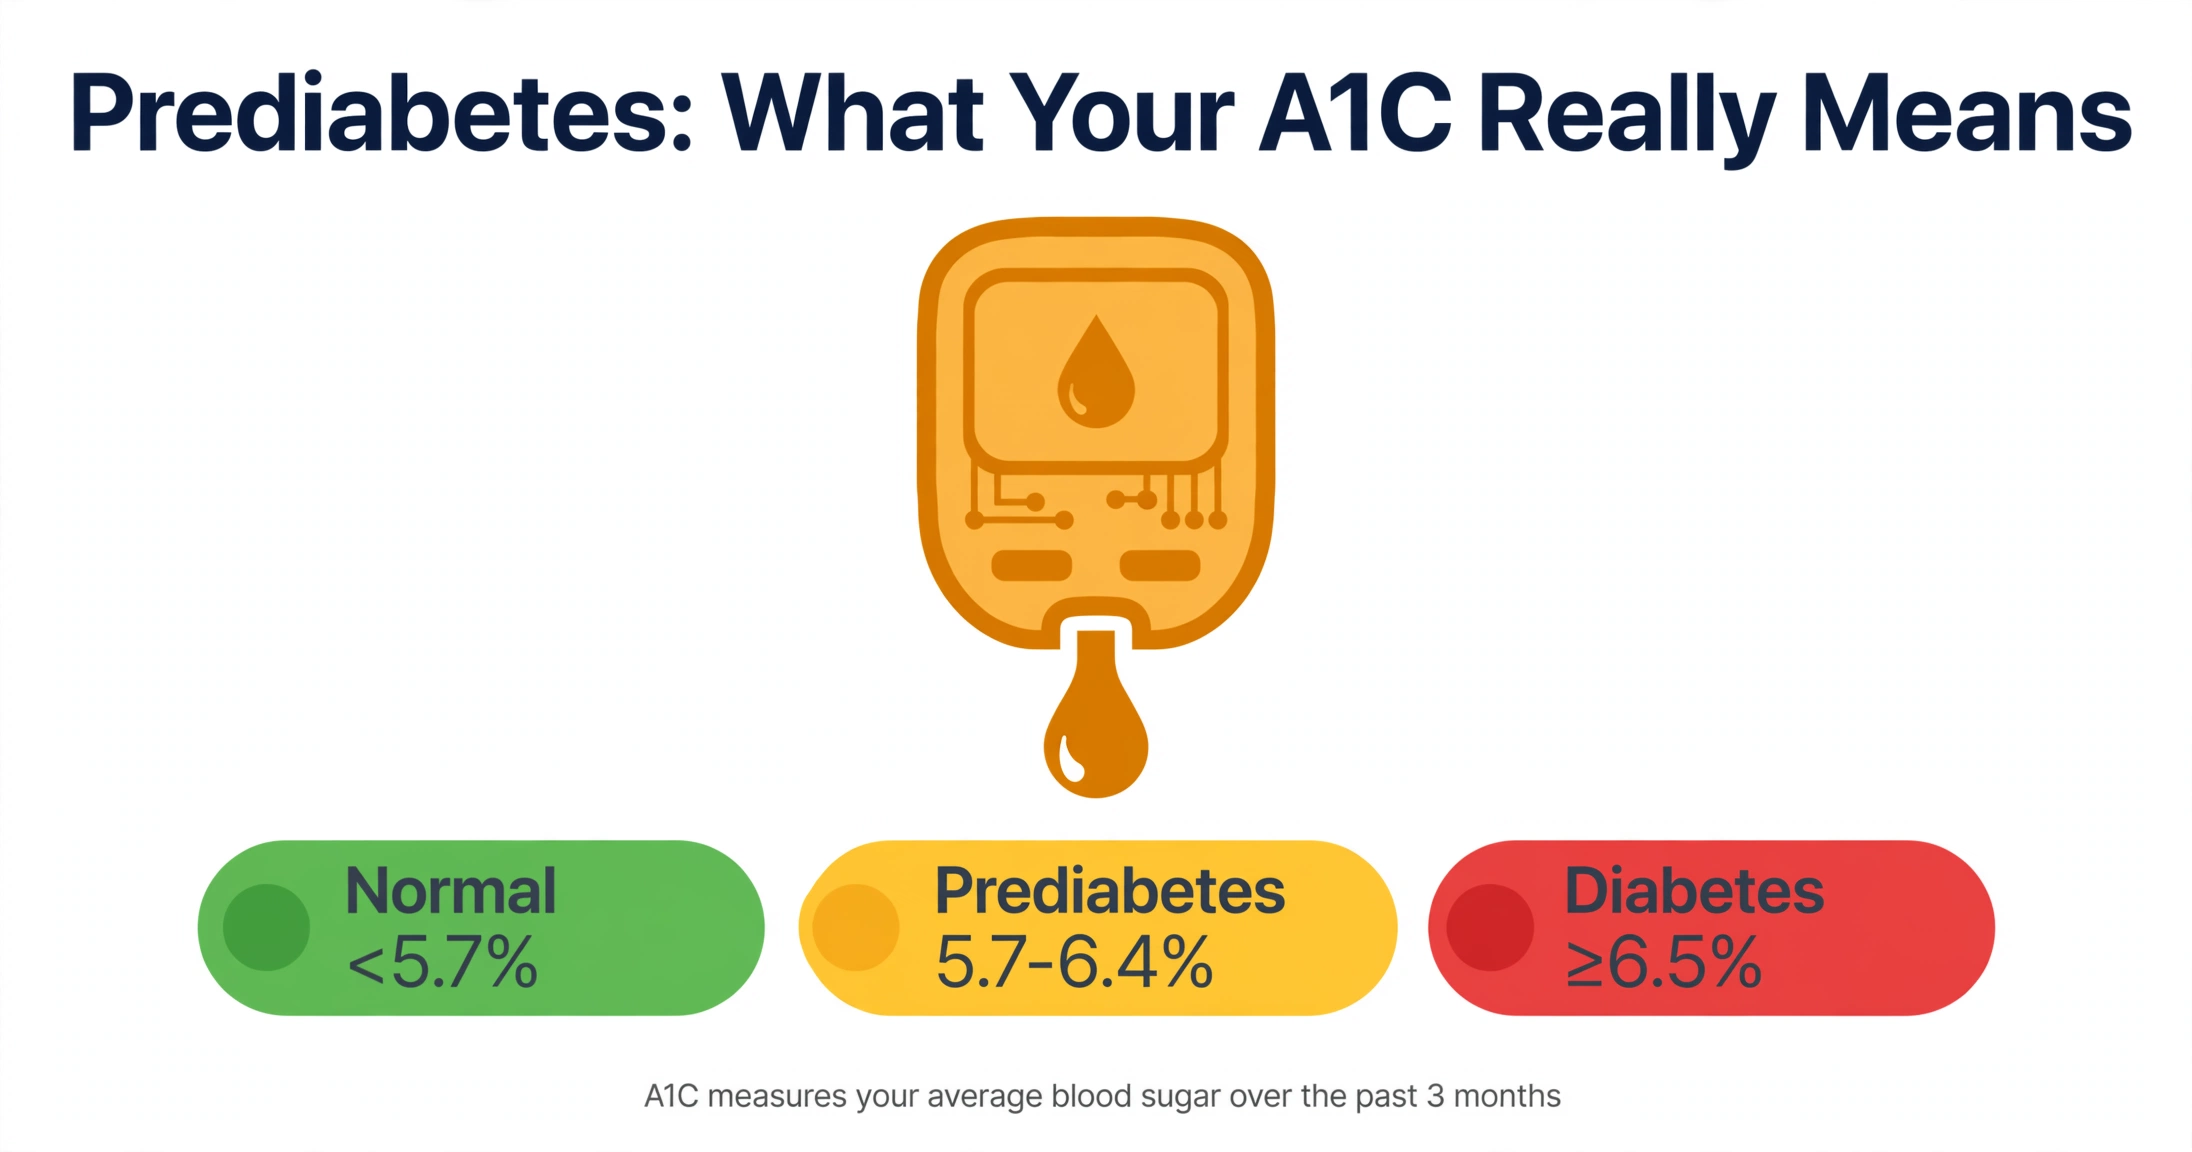
An A1C result between 5.7% and 6.4% falls in the prediabetes range defined by the American Diabetes Association.
Key Takeaways
- Prediabetes is defined by an A1C of 5.7% to 6.4%, below the diabetes threshold of 6.5%.
- A1C reflects average blood sugar over about two to three months through glycated hemoglobin.
- The Diabetes Prevention Program found about 11% of participants with prediabetes progressed to type 2 diabetes each year without intervention.
- The 2018 AHA/ACC cholesterol guideline lists prediabetes as a cardiovascular risk-enhancing factor.
- The DPP lifestyle intervention — 7% weight loss and 150 minutes of weekly activity — cut progression risk by 58%.
Prediabetes means an A1C between 5.7% and 6.4% — blood sugar that is elevated but below the diabetes threshold of 6.5%. This range signals a higher likelihood of progressing to type 2 diabetes and an elevated risk of cardiovascular disease.
A1C is one of the most common numbers people see on lab reports, yet few understand what it actually measures. The percentage does not represent a single blood sugar reading. It reflects the average concentration of glucose in the blood over roughly two to three months, captured through a protein called hemoglobin. The ADA Standards of Care in Diabetes use this number to classify glucose regulation into normal, prediabetes, and diabetes ranges.1
The sections below walk through each layer of meaning behind an A1C result: what prediabetes is and how common it is, the exact ranges and how other glucose tests compare, how the test itself works, what the major clinical trials found about progression and heart risk, and how clinicians typically monitor the condition over time.
What Is Prediabetes?
Prediabetes describes a state in which blood glucose levels sit above the normal range but below the threshold used to classify diabetes. The body still produces insulin, but it either uses that insulin less efficiently — a condition called insulin resistance — or the pancreas gradually produces less of it. Glucose accumulates in the bloodstream instead of moving into cells as readily as it once did.
Most people with prediabetes notice no symptoms. The condition rarely announces itself through thirst, fatigue, or frequent urination, which is why lab testing usually uncovers it. A person might feel entirely well while their A1C has been sitting at 6.0% for a year or more. This silence is part of what makes routine screening important: without a blood test, elevated glucose can go unnoticed for a long stretch.
Prediabetes is remarkably common. The CDC's National Diabetes Statistics Report estimated that about 96 million American adults — more than one in three — had prediabetes based on 2019 data.9 The same report found that most people with prediabetes did not know they had it. Because the condition is so widespread and so often undetected, clinicians frequently discuss A1C results in the prediabetes range even when the patient came in for an unrelated reason.
Researchers describe prediabetes as a high-risk state rather than a mild version of diabetes. A widely cited review in The Lancet by Tabák and colleagues framed it as a period when the trajectory toward diabetes — and toward cardiovascular complications — is still open to change.6 The same review noted that the risk associated with prediabetes varies considerably from person to person, depending on how close the glucose values sit to the diabetes threshold and on the presence of other risk factors.
Three tests can identify prediabetes: A1C, fasting plasma glucose, and the two-hour oral glucose tolerance test (OGTT). Each measures a different aspect of glucose regulation, and a person can fall in the prediabetes range on one test while landing in the normal range on another. Clinicians interpret the tests together rather than relying on a single number in isolation.
A1C Ranges Explained
The ADA Standards of Care in Diabetes define three A1C categories. Below 5.7% is considered normal. From 5.7% to 6.4% is prediabetes. At or above 6.5% is diabetes.1 These cutoffs come from observing where the risk of diabetes complications, such as retinopathy, begins to rise in population studies — not from an arbitrary dividing line.
A1C is not the only way to classify glucose status. Fasting plasma glucose and the two-hour OGTT have their own prediabetes thresholds, and they do not always agree with the A1C. The table below shows all three side by side.
| Test | Normal | Prediabetes | Diabetes |
|---|---|---|---|
| A1C | Below 5.7% | 5.7% to 6.4% | 6.5% or higher |
| Fasting plasma glucose | Below 100 mg/dL | 100 to 125 mg/dL | 126 mg/dL or higher |
| 2-hour oral glucose tolerance test | Below 140 mg/dL | 140 to 199 mg/dL | 200 mg/dL or higher |
The boundaries matter because risk is not flat across the prediabetes range. A person at 5.8% sits close to normal, while a person at 6.4% sits one step from the diabetes threshold. Research shows that progression risk climbs as the starting A1C rises, so a result at the upper end of the range carries different implications than one at the lower end.6
Clinicians also consider whether an A1C result can be trusted in a given patient. Certain conditions change how A1C behaves. Anemia, hemoglobin variants such as sickle cell trait, chronic kidney disease, and pregnancy can all shift the result independent of actual blood sugar. When any of these are present, clinicians often weigh fasting glucose or OGTT results more heavily.1
A single elevated reading usually prompts confirmatory testing before any classification is finalized. The ADA notes that repeat testing is standard practice, ideally with the same test repeated on a different day. Lab variation, sample handling, and temporary physiological changes can all nudge a single result up or down by a tenth of a point or two — enough to matter at the boundaries.
It also helps to keep perspective on how these categories function. They are clinical classification tools, not measurements of how a person feels or how healthy they are overall. Two people with the same A1C can have different daily glucose patterns, different symptoms, and different overall risk profiles. The number is a starting point for evaluation, not the whole picture.
How A1C Is Measured
A1C measures glycated hemoglobin — hemoglobin molecules in red blood cells that have glucose attached to them. When blood sugar rises, more glucose sticks to hemoglobin. When it falls, less attaches. Because red blood cells live for roughly 120 days, the proportion of glycated hemoglobin reflects the average glucose concentration over the preceding two to three months.3
The test is a weighted average, not a simple one. Recent weeks influence the result more than weeks two or three months back. Roughly half of the A1C value comes from the most recent month of glucose exposure, while the earlier months contribute progressively less. This weighting means that a stretch of high readings last week moves the number more than the same stretch two months ago.
The relationship between A1C and average glucose is not a guess. The A1c-Derived Average Glucose (ADAG) study, led by Nathan and colleagues and published in Diabetes Care in 2008, measured A1C alongside frequent glucose readings in hundreds of participants with and without diabetes.3 The researchers derived a linear formula that translates A1C into estimated average glucose (eAG):
eAG (mg/dL) = 28.7 × A1C − 46.7
This formula lets clinicians and patients translate a percentage into the same mg/dL units used by home glucose meters. The table below applies it to key points around the prediabetes range.
| A1C | Estimated Average Glucose (eAG) | Range |
|---|---|---|
| 5.7% | 117 mg/dL | Prediabetes (lower boundary) |
| 6.0% | 126 mg/dL | Prediabetes (mid-range) |
| 6.4% | 137 mg/dL | Prediabetes (upper boundary) |
| 6.5% | 140 mg/dL | Diabetes threshold |
| 7.0% | 154 mg/dL | Diabetes range (for reference) |
An A1C of 6.4% — the top of the prediabetes range — corresponds to an estimated average glucose of about 137 mg/dL. That is roughly the average of someone whose daily readings swing between, say, 100 and 175 mg/dL across the day. Two people with the same average can have very different patterns: one steady, one swinging widely. A1C captures the average but hides the variability.
Laboratory standardization keeps A1C results comparable across labs. In the United States, most labs report A1C aligned with the National Glycohemoglobin Standardization Program (NGSP), which traces back to the landmark Diabetes Control and Complications Trial. This alignment means a 6.2% from one lab should mean roughly the same thing as a 6.2% from another — though small differences between methods remain.
Point-of-care A1C devices, which give results in minutes from a fingerstick, have improved but can be less precise than laboratory testing. The ADA notes that point-of-care results used for classification purposes should come from devices with established accuracy. When a point-of-care result is unexpected, laboratories typically confirm it with a standard venous sample.
Progression Risk
The most influential evidence on prediabetes progression comes from the Diabetes Prevention Program (DPP), a large randomized trial published by Knowler and colleagues in the New England Journal of Medicine in 2002.2 The trial enrolled 3,234 adults with prediabetes — defined by elevated fasting and two-hour glucose — and assigned them to a placebo group, a metformin group, or an intensive lifestyle intervention group.
In the placebo group, about 11% of participants developed type 2 diabetes each year. That figure has become the standard reference for the natural course of prediabetes without intervention. It also illustrates an important nuance: 11% per year means that in any given year, most participants did not progress. Progression risk compounds over time, but it is not a certainty in any single year.
The two active arms showed how much that trajectory could shift. The intensive lifestyle group reduced progression by 58% relative to placebo. The metformin group reduced it by 31%. The lifestyle intervention targeted at least 7% weight loss and at least 150 minutes per week of moderate physical activity, supported by individual coaching sessions.2
Follow-up studies showed that the benefits did not vanish when the trial ended. The Diabetes Prevention Program Outcomes Study (DPPOS) tracked participants for years afterward. At the 10-year mark, the lifestyle group still showed a 34% lower diabetes incidence than the original placebo group, and at 15 years the lifestyle effect remained measurable.5,10 These long-term results suggest that the period of intervention produced durable changes, even though adherence naturally faded over time.
Several factors raise the likelihood of progression. Higher A1C within the prediabetes range predicts faster progression than values near the lower boundary. Excess body weight, particularly around the abdomen, increases insulin resistance. A family history of diabetes, a history of gestational diabetes, and physical inactivity all add to the risk. Age plays a role too, as glucose regulation tends to decline over the decades.6
The pattern of test results also matters. People who fall in the prediabetes range on both fasting glucose and the OGTT tend to carry higher progression risk than those who are elevated on only one measure. Similarly, an A1C at the top of the range combined with elevated fasting glucose paints a different picture than a lone borderline A1C. Clinicians often discuss which pattern a patient's results show when evaluating next steps.
🧮 Check Your Heart Risk
Prediabetes is a cardiovascular risk-enhancing factor. Calculate your 10-year ASCVD risk with the Pooled Cohort Equations.
Try the ASCVD Risk Calculator →Prediabetes and Heart Risk
Prediabetes carries implications beyond glucose. The 2018 AHA/ACC guideline on the management of blood cholesterol lists prediabetes among the risk-enhancing factors that clinicians consider when evaluating atherosclerotic cardiovascular disease (ASCVD) risk.4 This placement reflects a consistent finding across studies: people with prediabetes experience more cardiovascular events than people with normal glucose regulation.
A systematic review and meta-analysis by Huang and colleagues, published in the BMJ in 2016, pooled data from dozens of studies and found that prediabetes was associated with a higher risk of cardiovascular disease and all-cause mortality.7 The elevated risk appeared even before diabetes developed, suggesting that the cardiovascular consequences of impaired glucose regulation begin earlier than the diabetes threshold.
Several biological mechanisms help explain the connection. Insulin resistance — the core feature of prediabetes — promotes endothelial dysfunction, raises triglycerides, lowers HDL cholesterol, and often travels alongside elevated blood pressure. These changes together create a more favorable environment for atherosclerotic plaque to develop. Diabetes itself is already one of the major risk inputs in the ASCVD risk calculator, and prediabetes sits on the same biological continuum.11
Risk-enhancing factors enter clinical evaluation most often when the 10-year ASCVD risk falls in the borderline (5% to 7.5%) or intermediate (7.5% to 20%) range. In these ranges, the 2018 guideline notes that factors such as prediabetes, family history of premature cardiovascular disease, and elevated lipoprotein(a) can shift the overall assessment. A patient whose score sits at 8% might be viewed differently if prediabetes is also present than if it is not.4
The 2019 ACC/AHA guideline on the primary prevention of cardiovascular disease takes a similar view, listing prediabetes among the conditions that warrant attention in risk evaluation.8 Neither guideline treats prediabetes as equivalent to diabetes in the risk models — diabetes carries more weight — but both acknowledge that the prediabetes state adds information beyond the standard risk inputs.
This overlap is one reason clinicians often discuss A1C results and heart risk in the same conversation. A new A1C of 6.1% might prompt a clinician to recheck blood pressure, review lipid values, and reassess overall cardiovascular risk. Patients sometimes explore these connections themselves using tools like the ASCVD 10-year risk calculator or the Framingham Risk Score calculator, which model cardiovascular risk from the standard set of clinical inputs.11 For readers who want background on how those scores are interpreted, our overview of what counts as a good heart score explains the main scoring systems and their ranges.
Evidence-Based Steps to Address Prediabetes
When clinicians and researchers discuss addressing prediabetes, the conversation usually starts with the Diabetes Prevention Program. The DPP's intensive lifestyle intervention is the most thoroughly studied approach, and its results have shaped guidance worldwide.
The DPP lifestyle program set two concrete goals: lose at least 7% of body weight and get at least 150 minutes per week of moderate physical activity, such as brisk walking. Participants received 16 individual coaching sessions in the first 24 weeks, followed by monthly sessions. Dietary guidance focused on reducing total calorie and fat intake. The result was a 58% reduction in diabetes progression over an average of 2.8 years.2
The lifestyle effect was strongest in older participants. Among those aged 60 and older, the intervention cut progression by 71%. The benefit also extended beyond weight loss itself: participants who met the activity goal saw risk reductions even when weight loss fell short of the 7% target. This detail matters because it separates the value of movement from the value of the number on the scale.
Metformin was the DPP's pharmacologic arm, and it reduced progression by 31% overall.2 The effect was most pronounced in younger participants and in those with higher body mass index. The ADA Standards of Care note that metformin may be considered for adults with prediabetes who carry particularly high risk — for example, those with a history of gestational diabetes or a BMI of 35 or higher — while observing that lifestyle change remains the foundation.1 Patients often discuss the relative merits of each option with their clinician.
The DPPOS follow-up adds perspective on durability. Fifteen years after the original trial, the lifestyle group retained a lower diabetes incidence than the original placebo group, and microvascular complication rates remained lower in the lifestyle and metformin groups.5 The metformin effect on diabetes incidence also persisted, though the lifestyle arm showed the larger sustained benefit.
Other trials around the world have reinforced the DPP's findings. The Finnish Diabetes Prevention Study and the Da Qing Diabetes Prevention Study in China both found that structured lifestyle programs reduced diabetes incidence in people with impaired glucose tolerance. The Da Qing study, with follow-up extending to 30 years, found lower rates of cardiovascular events and death among participants originally assigned to lifestyle intervention — a striking demonstration of long-term effects from a relatively short period of intensive support.
It is worth noting what the evidence does not show. No trial has found that supplements, detox regimens, or specific "superfoods" reverse prediabetes. The interventions with strong evidence share a common structure: sustained calorie moderation, regular physical activity, and ongoing support. Results also vary by individual — the 58% figure is a group average, not a promise about any single person.
🧮 Check Your Framingham Risk Score
Estimate your 10-year risk of coronary heart disease using the Framingham model and see how your risk factors combine.
Try the Framingham Calculator →Monitoring and Follow-Up
An A1C result in the prediabetes range typically leads to a monitoring plan. The ADA Standards of Care recommend that people with prediabetes have their A1C checked at least once a year, with more frequent testing when clinicians are actively following changes.1 Because A1C reflects two to three months of average glucose, retesting sooner than every three months usually adds little new information.
Follow-up visits often cover more than the A1C number. Clinicians commonly recheck blood pressure, weight, and lipid values alongside glucose, since prediabetes frequently coexists with other cardiovascular risk factors. This broader panel helps place the A1C in the context of overall metabolic health rather than treating it as an isolated figure. Our ASCVD vs PREVENT comparison explains how the two main cardiovascular risk models use these inputs differently.
The ADA also recommends that adults with prediabetes be referred to an intensive lifestyle program modeled on the DPP, such as CDC-recognized diabetes prevention programs. These programs deliver the structured curriculum — diet, activity, and behavioral support — that produced the trial results. Participation is voluntary, and clinicians often discuss what such programs involve so patients can decide whether they fit their circumstances.
A1C results at follow-up can move in either direction. Some people return to the normal range below 5.7%. Others remain stable within the prediabetes range for years. Still others cross the 6.5% threshold, at which point the classification changes. Each of these outcomes carries different implications, and clinicians interpret the trend — not just the latest number — when evaluating progress.
Screening itself follows a schedule. The ADA recommends screening adults aged 35 and older for prediabetes and diabetes, with repeat testing at least every three years when results are normal and risk factors are absent.1 People with risk factors such as overweight, family history, or high blood pressure often get screened earlier and more often. Once prediabetes is identified, the annual monitoring cadence takes over.
Frequently Asked Questions
Can prediabetes go away?
What A1C number indicates prediabetes?
How quickly can A1C change?
Does prediabetes always lead to type 2 diabetes?
Why does prediabetes matter for heart health?
Sources
- American Diabetes Association. Standards of Care in Diabetes—2025. Diabetes Care. 2025;48(Suppl.1):S1-S352.
- Knowler WC, Barrett-Connor E, Fowler SE, et al.; Diabetes Prevention Program Research Group. Reduction in the incidence of type 2 diabetes with lifestyle intervention or metformin. N Engl J Med. 2002;346(6):393-403.
- Nathan DM, Kuenen J, Borg R, Zheng H, Schoenfeld D, Heine RJ; A1c-Derived Average Glucose Study Group. Translating the A1C assay into estimated average glucose values. Diabetes Care. 2008;31(8):1473-1478.
- Grundy SM, Stone NJ, Bailey AL, et al. 2018 AHA/ACC Guideline on the Management of Blood Cholesterol. Circulation. 2019;139(25):e1082-e1143.
- Diabetes Prevention Program Research Group. Long-term effects of lifestyle intervention or metformin on diabetes development and microvascular complications over 15-year follow-up: the Diabetes Prevention Program Outcomes Study. Lancet Diabetes Endocrinol. 2015;3(11):866-875.
- Tabák AG, Herder C, Rathmann W, Brunner EJ, Kivimäki M. Prediabetes: a high-risk state for diabetes development. Lancet. 2012;379(9833):2279-2290.
- Huang Y, Cai X, Mai W, Li M, Hu Y. Association between prediabetes and risk of cardiovascular disease and all cause mortality: systematic review and meta-analysis. BMJ. 2016;355:i5953.
- Arnett DK, Blumenthal RS, Albert MA, et al. 2019 ACC/AHA Guideline on the Primary Prevention of Cardiovascular Disease. Circulation. 2019;140(11):e596-e646.
- Centers for Disease Control and Prevention. National Diabetes Statistics Report, 2020. Atlanta, GA: U.S. Department of Health and Human Services; 2020.
- Diabetes Prevention Program Research Group. 10-year follow-up of diabetes incidence and weight loss in the Diabetes Prevention Program Outcomes Study. Lancet. 2009;374(9702):1677-1686.
- Goff DC Jr, Lloyd-Jones DM, Bennett G, et al. 2013 ACC/AHA Guideline on the Assessment of Cardiovascular Risk. Circulation. 2014;129(25 Suppl 2):S49-S73.
- American Diabetes Association. Standards of Care in Diabetes—2024. Diabetes Care. 2024;47(Suppl.1):S1-S321.
Editorial review: This article was reviewed by Dr. Heart (Health Observer) and the Heart Score Calculator Editorial Team on October 18, 2026. Eric Jason is a medical data analyst, not a licensed physician (not an MD); this content does not replace advice from a licensed healthcare professional.