ASCVD vs PREVENT Calculator: Key Differences Explained
The PREVENT calculator is the American Heart Association's 2023 replacement for the 2013 ASCVD risk estimator. It covers ages 30 to 79, adds kidney and metabolic measures, and reports both 10-year and 30-year cardiovascular risk.
The ASCVD Pooled Cohort Equations (2013) and the AHA PREVENT equations (2023) estimate cardiovascular risk using different variables, age ranges, and time horizons.
Key Takeaways
- PREVENT is the AHA's 2023 model; the ASCVD estimator is the 2013 Pooled Cohort Equations.
- PREVENT covers ages 30–79; the ASCVD estimator covers ages 40–79.
- PREVENT adds kidney function (eGFR), BMI, albuminuria, and a social deprivation index.
- PREVENT reports 10-year and 30-year risk of total cardiovascular disease, including heart failure.
- PREVENT scores run lower on average because the model was calibrated to contemporary event rates.
The PREVENT calculator is the newer model: published by the American Heart Association in 2023, it estimates 10-year and 30-year cardiovascular risk using more variables than the 2013 ASCVD Pooled Cohort Equations. For most adults aged 30 to 79, current guidelines point toward PREVENT, while an existing ASCVD score remains useful as a historical reference.
The two calculators answer related but different questions. The ASCVD estimator predicts the chance of a first atherosclerotic event — heart attack, stroke, or cardiovascular death — over 10 years. PREVENT predicts total cardiovascular disease, adding heart failure to the outcome, over 10 and 30 years. The difference in scope explains much of the confusion when the two models produce different numbers for the same person.
What Is the ASCVD Risk Estimator?
The ASCVD Risk Estimator is the 2013 Pooled Cohort Equations (PCE), developed under the American College of Cardiology and American Heart Association guideline on cardiovascular risk assessment. The equations were published by Goff and colleagues in Circulation in 2014 and became the standard tool for estimating 10-year risk of a first hard atherosclerotic cardiovascular event.1
The PCE was derived from five long-term cohort studies: the Atherosclerosis Risk in Communities (ARIC) study, the Coronary Artery Risk Development in Young Adults (CARDIA) study, the Cardiovascular Health Study (CHS), and the Framingham Heart Study Original and Offspring cohorts.1 These studies followed participants for decades, recording risk factors and cardiovascular outcomes. Statistical models translated the observed patterns into equations that estimate risk for new patients.
The PCE uses nine inputs: age, sex, race (Black or White), total cholesterol, HDL cholesterol, systolic blood pressure, blood pressure treatment status, diabetes status, and smoking status. The model applies separate equations for four groups: Black men, Black women, White men, and White women. The output is a single percentage: the estimated probability of nonfatal myocardial infarction, coronary heart disease death, or fatal or nonfatal stroke within 10 years.
The 2018 ACC/AHA cholesterol guideline organized PCE results into four categories: below 5% (low), 5% to 7.4% (borderline), 7.5% to 19.9% (intermediate), and 20% or higher (high).4 These thresholds shaped preventive care for a decade. The 7.5% mark became the key decision point for discussing statin therapy in primary prevention. Millions of treatment decisions followed from where a patient's number fell relative to these cutoffs.
Validation studies found the PCE generally performed well but tended to overestimate risk in some contemporary populations. Muntner and colleagues, validating the equations in the REGARDS cohort, reported that observed event rates were lower than predicted in several subgroups.5 This overestimation was one of the motivations for developing a recalibrated model. The PCE also built on the earlier Framingham Risk Score methodology, extending it to a more diverse population.1 The ASCVD risk calculator on this site uses the original PCE from the 2013 guideline.1
What Is the PREVENT Calculator?
The PREVENT calculator is the American Heart Association's 2023 risk model. PREVENT stands for Predicting Risk of Cardiovascular Disease EVENTs. The equations were published as an AHA scientific statement by Khan and colleagues, appearing in Circulation in 2024.2 The model was designed to address the PCE's limitations: older derivation data, a narrower age range, and the absence of kidney and metabolic measures.
PREVENT was derived and validated using 25 datasets covering more than 6 million adults.2 This is a far larger and more contemporary population than the PCE's derivation cohorts. The datasets include electronic health record data, which allowed the model to incorporate variables that older cohort studies did not collect systematically.
The model adds several predictors the PCE lacks. Estimated glomerular filtration rate (eGFR) captures kidney function, an independent cardiovascular risk factor. Body mass index adds a metabolic dimension. Urine albumin-to-creatinine ratio (UACR) and hemoglobin A1c are optional inputs for patients with diabetes. A social deprivation index, derived from ZIP code, accounts for neighborhood-level social determinants of health. The core nine PCE variables remain in the model.
PREVENT's scope is broader in three ways. First, it covers adults aged 30 to 79, extending risk estimation to adults in their thirties for whom the PCE was never validated. Second, it reports both 10-year and 30-year risk, giving younger patients a meaningful long-term number. Third, it estimates total cardiovascular disease — atherosclerotic events plus heart failure — rather than atherosclerotic events alone. The 10-year risk categories follow the same thresholds clinicians use with the PCE:
| PREVENT 10-Year Risk | Category | Clinical Meaning |
|---|---|---|
| Below 5% | Low Risk | Low estimated probability of total CVD in 10 years |
| 5% to 7.4% | Borderline Risk | Borderline probability; additional risk factors often evaluated |
| 7.5% to 19.9% | Intermediate Risk | Moderate probability; risk-enhancing factors often evaluated |
| 20% or Higher | High Risk | High estimated probability; intensive evaluation commonly discussed |
The inclusion of heart failure reflects the AHA's cardiovascular-kidney-metabolic (CKM) health framework, described in a 2023 presidential advisory.3 CKM health recognizes that heart disease, kidney disease, diabetes, and obesity share pathways and frequently occur together. A risk model that ignores heart failure and kidney function misses a large share of the cardiovascular burden. This site hosts an AHA PREVENT calculator following the published equations.2
Key Differences: Side-by-Side Comparison
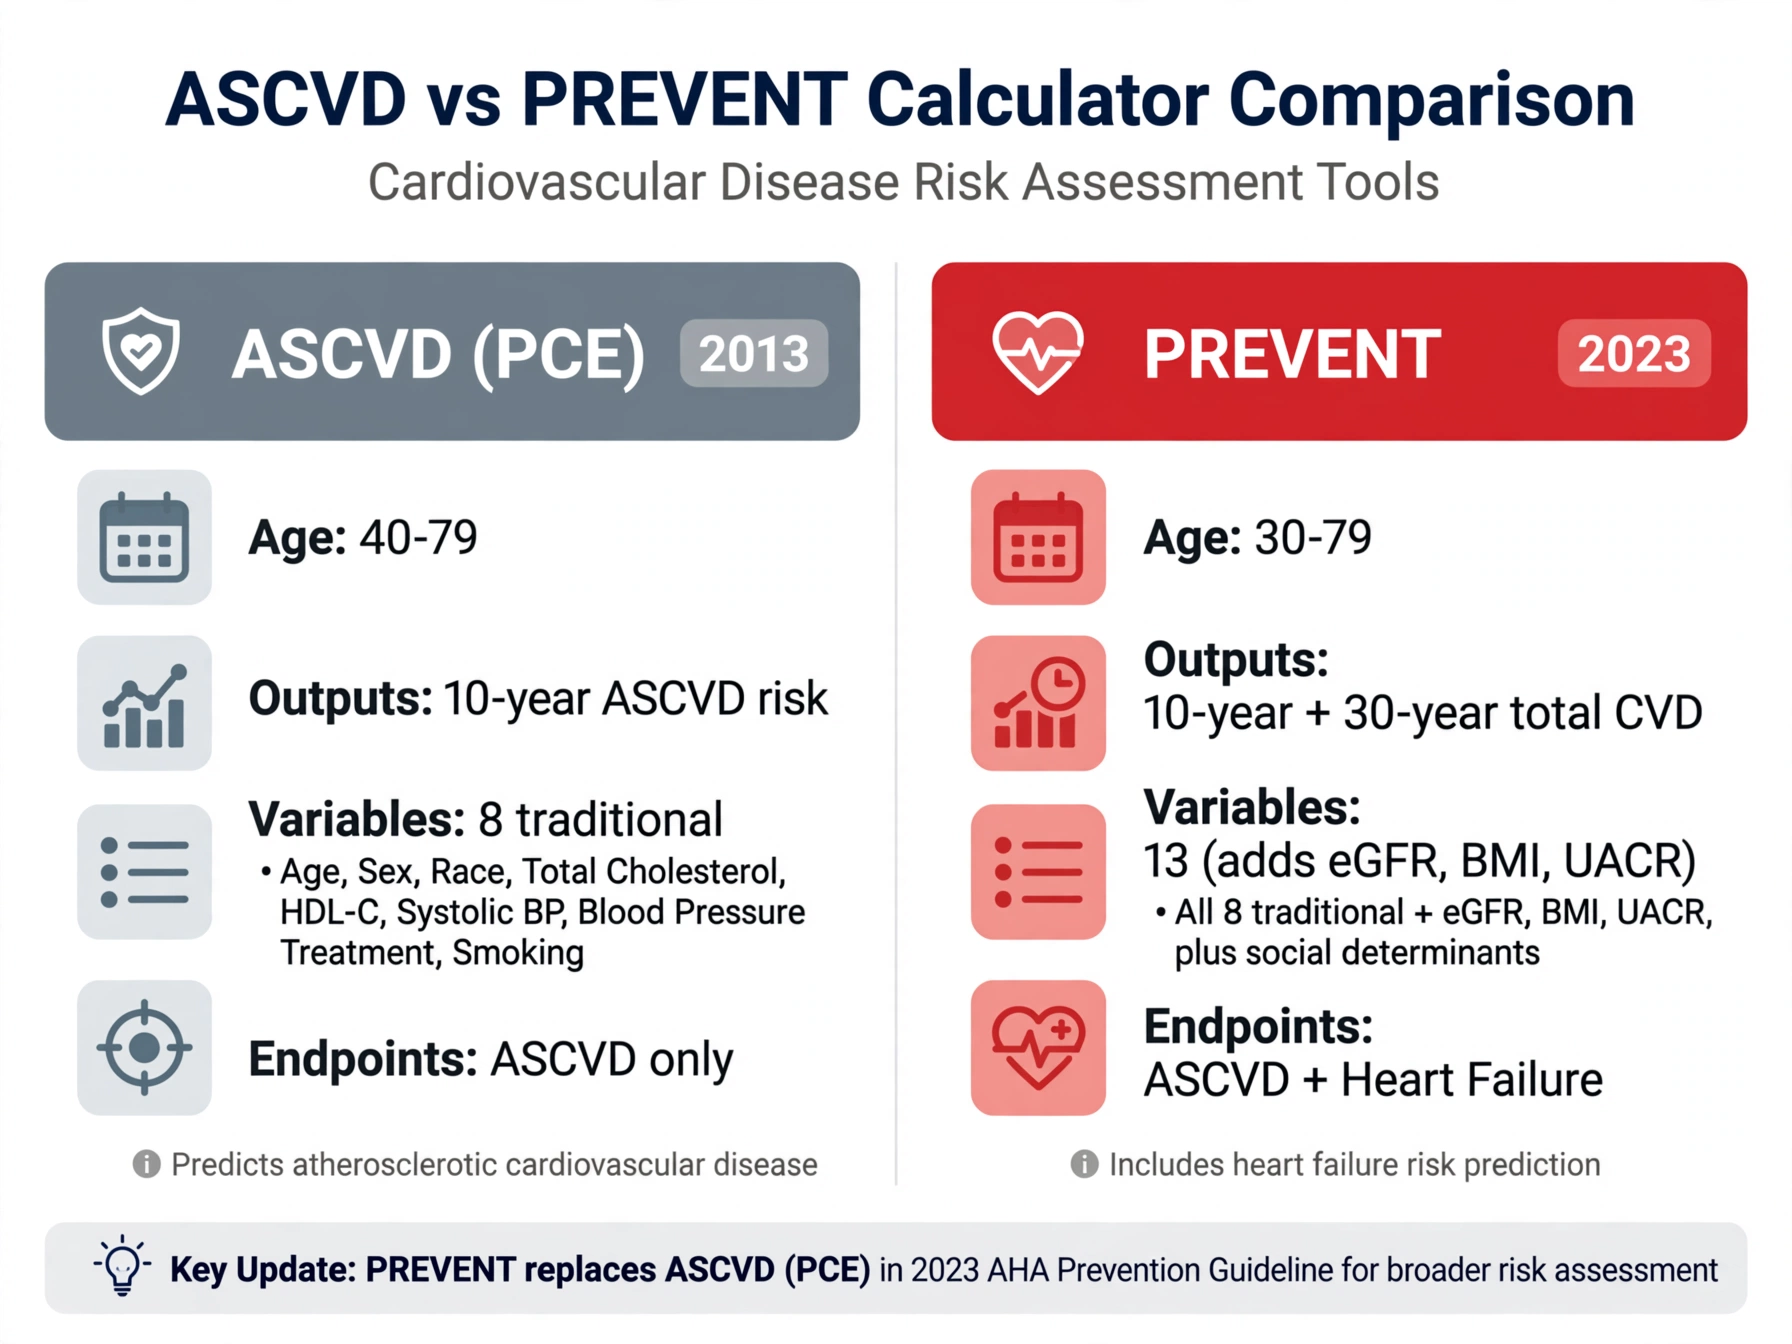
The main differences between the models are age range, variables, time horizons, and endpoints. PREVENT covers ages 30 to 79, adds kidney and metabolic measures, and reports 30-year risk including heart failure. The PCE covers ages 40 to 79 with nine variables and reports 10-year atherosclerotic risk only. The table below summarizes the comparison.
| Feature | ASCVD PCE (2013) | PREVENT (2023) |
|---|---|---|
| Publication year | 2013 (guideline), 2014 (journal) | 2023 (statement), 2024 (journal) |
| Age range | 40–79 years | 30–79 years |
| Derivation data | 5 pooled cohort studies | 25 datasets, >6 million adults |
| Core variables | 9 (age, sex, race, TC, HDL, SBP, BP Rx, diabetes, smoking) | Same 9, plus eGFR and BMI |
| Additional variables | None | UACR and HbA1c (optional); social deprivation index |
| Time horizon | 10 years | 10 years and 30 years |
| Endpoints | Nonfatal MI, CHD death, fatal/nonfatal stroke | Above plus heart failure (total CVD) |
| Discrimination (C-statistic) | Approximately 0.74 | Approximately 0.79 |
| Race handling | Separate Black/White equations | Expanded categories plus social deprivation index |
The C-statistic measures discrimination: how well a model separates people who will experience events from those who will not. A value of 0.50 is no better than chance; 1.00 is perfect. PREVENT's reported value near 0.79 versus roughly 0.74 for the PCE indicates meaningfully better discrimination in validation samples.2 The improvement comes from the larger derivation population, the added predictors, and calibration to contemporary event rates.
Race handling also differs. The PCE uses separate equations for Black and White adults, a structure that has drawn criticism for embedding race as a biological variable. PREVENT expanded race categories and added the social deprivation index, which captures neighborhood-level factors — income, education, housing — that influence health outcomes. This shift reflects a broader move in clinical prediction toward measuring social context directly rather than using race as a proxy.2
The age extension matters clinically. Adults in their thirties with elevated cholesterol or blood pressure previously had no validated 10-year risk tool; the PCE simply did not apply below age 40. PREVENT's 30-year estimate gives these patients a number that reflects their long-term trajectory. Researchers have long noted that 10-year risk understates the importance of risk factors in younger adults, and the 30-year horizon addresses that gap directly.8
Why PREVENT Scores Are Lower
PREVENT scores typically run lower than PCE scores for the same person. In population samples, mean 10-year risk was approximately 4.3% under PREVENT compared with approximately 8.0% under the PCE.2 This gap surprises patients who recalculate and see a smaller number. The difference comes from recalibration to contemporary event rates, not from an error in either model.
Cardiovascular event rates have fallen substantially since the PCE's derivation cohorts were followed. Smoking rates declined. Blood pressure treatment improved. Statin use expanded. The ARIC, Framingham, and CHS cohorts reflect an era with higher baseline event rates than today. When PREVENT was calibrated to recent data — including electronic health records from the 2010s and 2020s — the baseline survival rates were higher, which mechanically lowers predicted risk for the same risk factor profile.
Additional predictors also redistribute risk. When a model gains informative variables like eGFR, it can distinguish high-risk from low-risk patients more precisely. Some of the risk previously attributed to the core variables shifts to the new ones. Patients with normal kidney function and normal BMI may see lower estimates because the model now accounts for the absence of these risk amplifiers explicitly.
A lower PREVENT number does not mean cardiovascular risk has disappeared or that existing risk factors no longer matter. It means the absolute probability of an event in the next 10 years, estimated from contemporary data, is lower than the older model suggested. The relative importance of blood pressure, cholesterol, smoking, and diabetes is unchanged. Clinicians continue to evaluate these factors when discussing prevention, regardless of which model produced the number.
Researchers have examined whether the recalibration is appropriate or whether it understates risk for certain groups. Validation across the 25 PREVENT datasets showed good calibration overall, but calibration can vary by subgroup and health system.2 As with any population model, the estimate describes group probability, not individual fate. The debate over the right baseline is ongoing and is one reason guideline committees are transitioning carefully rather than all at once.
🧮 Try the PREVENT Calculator
Calculate your 10-year and 30-year cardiovascular risk using the 2023 AHA PREVENT equations.
Try the PREVENT Calculator →The Statin Controversy
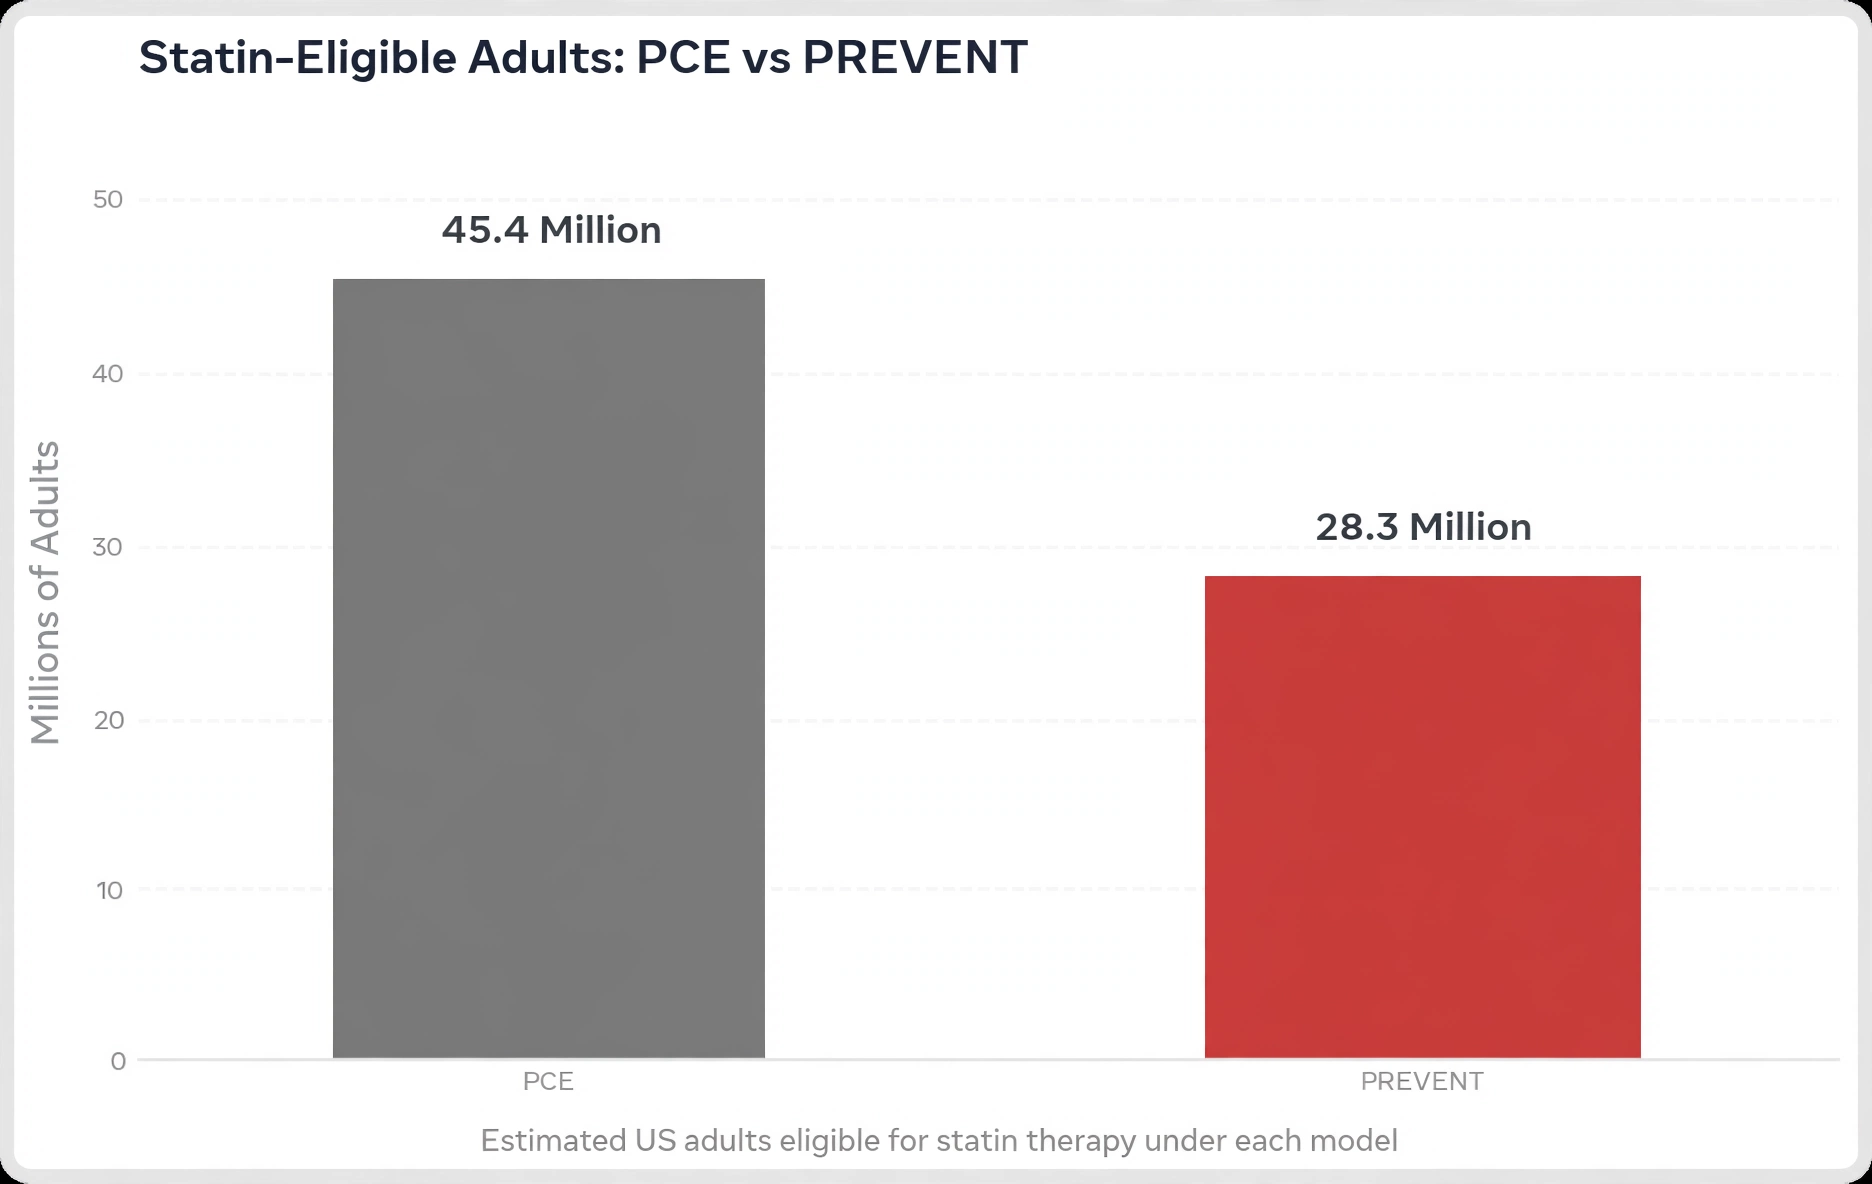
When 2018 guideline statin thresholds are applied to both models, PREVENT classifies substantially fewer adults as statin-eligible. In U.S. population analyses, the estimated number of adults meeting the thresholds fell from roughly 45.4 million under the PCE to roughly 28.3 million under PREVENT.9 This 17-million-person gap has generated the most visible debate around the new model.
The arithmetic behind the gap is straightforward. The 2018 cholesterol guideline uses 7.5% 10-year risk as the threshold for discussing statin therapy in primary prevention, with 20% marking high risk.4 Because PREVENT's mean risk is roughly half the PCE's, a large share of adults who fell just above 7.5% under the PCE fall just below it under PREVENT. The threshold did not move; the distribution of scores shifted beneath it.
One interpretation holds that the shift corrects overtreatment. If the PCE overestimated contemporary risk — as validation studies suggested5 — then millions of adults may have been offered statins based on inflated numbers. Under this view, PREVENT aligns treatment with actual event rates and spares people medication with limited expected benefit. Proponents note that the model's better discrimination supports this reading.
The competing interpretation warns of under-treatment. A lower 10-year number does not erase lifetime risk, and critics argue that moving millions below the treatment threshold could forfeit preventive benefit, particularly for younger adults whose 30-year risk remains elevated. Under this view, recalibration to lower event rates — which partly reflects better treatment in the population — risks a circular logic: treating fewer people because treated populations have fewer events.
Guideline committees are weighing both positions. The transition is gradual: recommendations now reference PREVENT while acknowledging the PCE's long track record, and clinicians are advised to consider the full clinical picture rather than a single number.6 Patients who were already taking statins based on PCE estimates are generally not advised to stop based on a recalculated PREVENT score alone; that decision involves the prescribing clinician and the patient's history. At its core, the controversy is about thresholds and treatment philosophy, not about which equation does better arithmetic.
Which Calculator Should You Use?
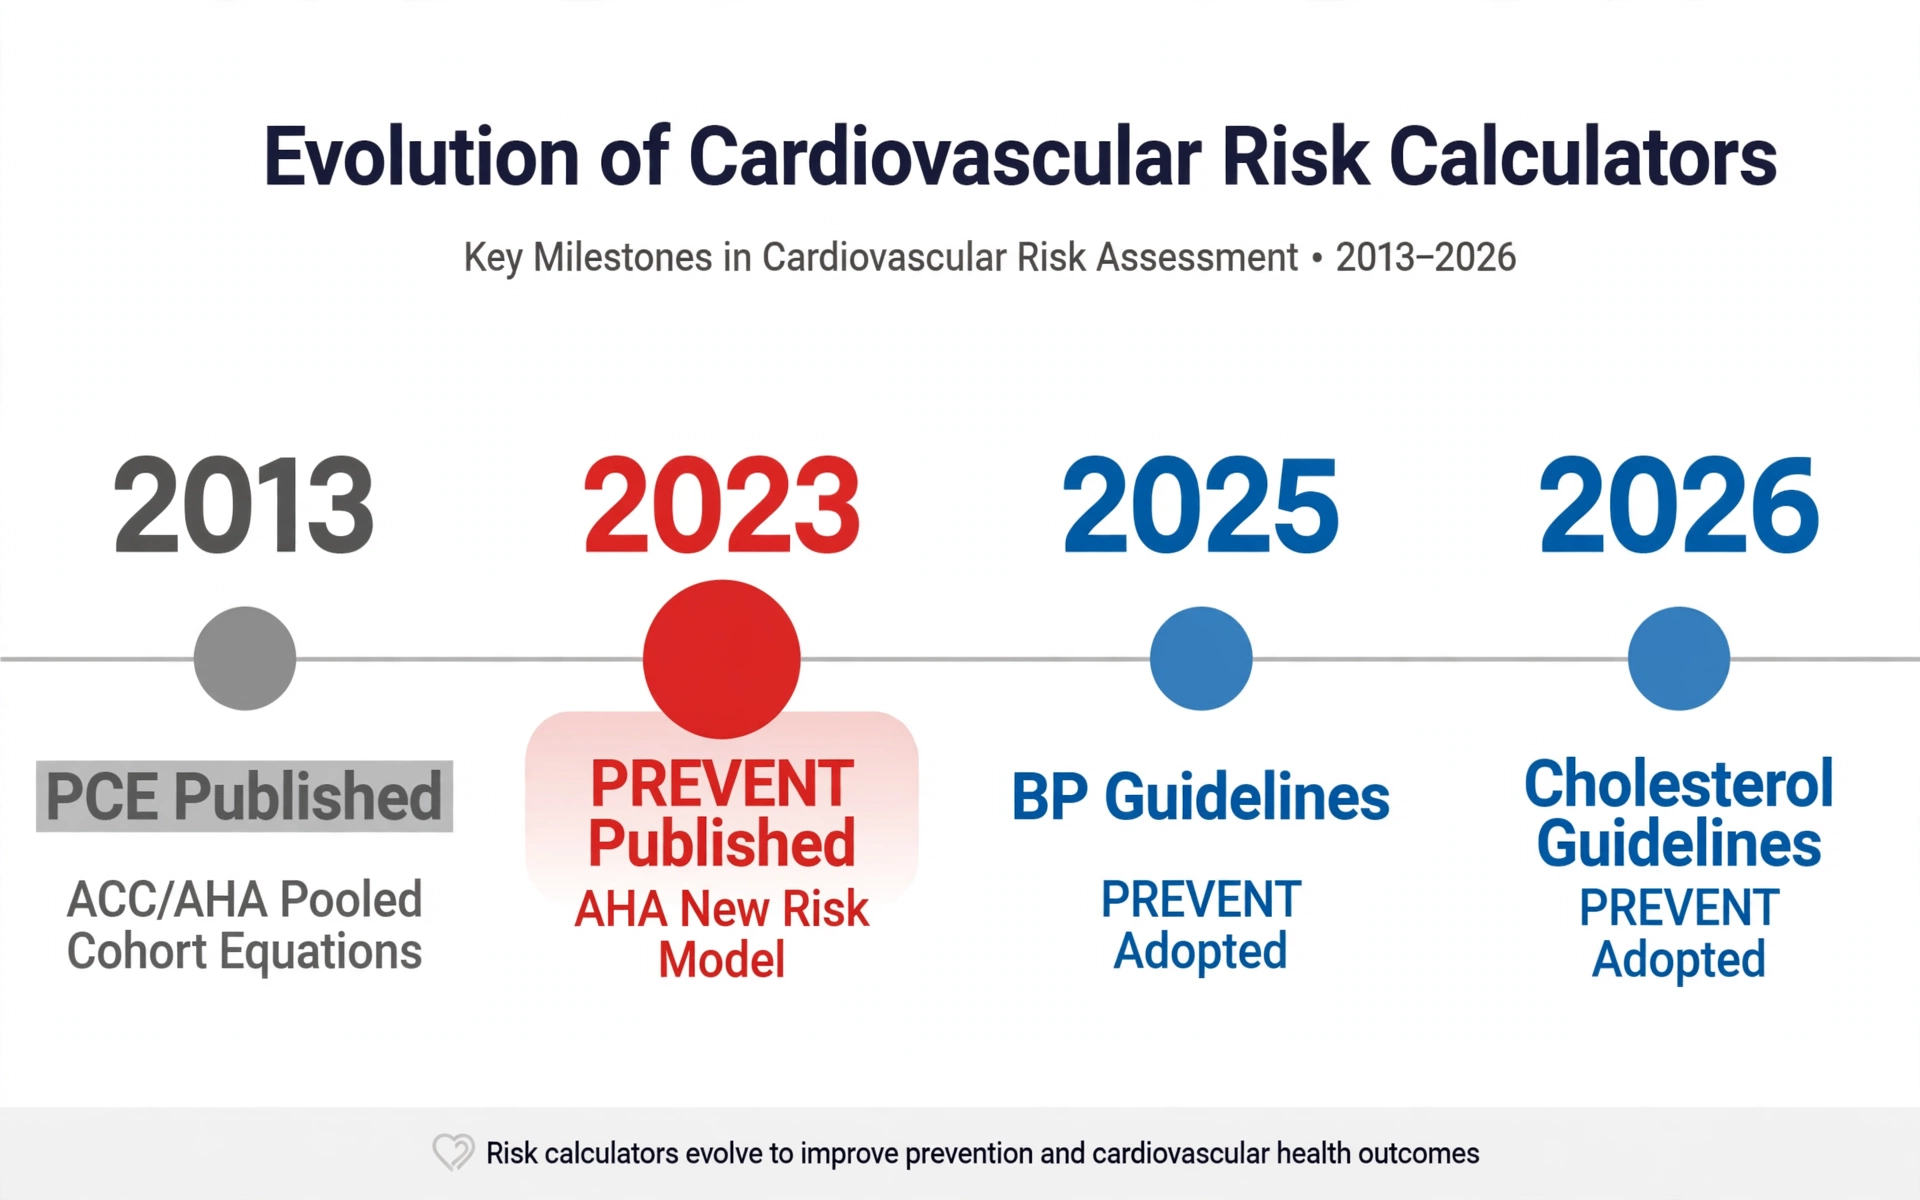
For adults aged 30 to 79, current guidance favors PREVENT. The 2025 AHA/ACC hypertension guideline incorporated the PREVENT equations into its risk assessment framework, and the 2026 cholesterol guideline update referenced them.6 These adoptions signal the direction of clinical practice, even as the transition remains in progress.
Age is the clearest decision rule. For adults aged 30 to 39, PREVENT is the only validated option; the PCE was never derived or validated below age 40, and applying it to younger adults produces unreliable estimates. For adults aged 40 to 79, both models can be calculated, but newer guidelines point toward PREVENT as the preferred tool.
The PCE still appears in many existing tools, clinical trial reports, and research datasets. Historical continuity has value: a patient whose risk has been tracked with the PCE for years may want to keep that series for comparison. Clinicians sometimes calculate both during the transition period to understand how the models differ for a specific patient. The two numbers are not interchangeable, but seeing both can illustrate what recalibration changes and what it leaves intact.
Data availability also matters. PREVENT's optional inputs — UACR, HbA1c, and ZIP-code-based social deprivation index — improve the estimate when available but are not required. The base PREVENT model runs on the same core variables as the PCE plus eGFR and BMI. Most patients will have these values from routine care. When eGFR is unavailable, clinicians evaluate whether the PCE or a base PREVENT calculation is more appropriate for the situation.
Patients often ask which number to trust when the two disagree. The models disagree most when the PCE estimate sits near a treatment threshold — for example, 8% under PCE versus 4.5% under PREVENT. In these cases, clinicians look beyond either number: coronary artery calcium scoring, family history, lipoprotein(a), and lifetime risk all inform the discussion.4 The calculator provides a starting point; the clinical picture provides the context. Our guide to heart score ranges explains what each category means in practice.
What This Means for Your Existing ASCVD Score
An existing ASCVD score remains a valid historical reference. It was calculated correctly under the model available at the time, using the best available equations. The arrival of PREVENT does not retroactively invalidate prior estimates. It provides a newer lens for current and future assessment.
The two scores should not be directly compared as if they measured the same thing. The PCE estimates 10-year risk of atherosclerotic events; PREVENT estimates 10-year and 30-year risk of total cardiovascular disease including heart failure. A PCE score of 9% and a PREVENT score of 5% for the same person do not contradict each other. They answer different questions on different scales, calibrated to different eras.
For a current estimate, recalculation with PREVENT is the appropriate step — not a conversion of the old number. There is no reliable formula to translate a PCE score into a PREVENT score because the models differ in variables, endpoints, and calibration. A fresh calculation with current risk factor values produces the most meaningful result. Clinicians typically recalculate during routine risk reassessment, which guidelines suggest every 4 to 6 years for primary prevention populations.4
A lower PREVENT number does not mean prior risk factors have vanished. Blood pressure, cholesterol, smoking history, and diabetes status carry the same biological significance regardless of which model quantifies them. Patients with an intermediate PCE score who recalculate to a lower PREVENT score still benefit from attention to modifiable risk factors. The number changed; the arteries did not.
Keeping records of both scores is useful. The PCE score documents the historical assessment and the basis for past decisions. The PREVENT score documents the current estimate under contemporary calibration. Together they tell a fuller story than either alone. When discussing results, bringing both numbers — along with recent blood pressure, cholesterol, and kidney function values such as estimated glomerular filtration rate (eGFR) — gives the clinician the complete picture needed for shared decision-making.
🧮 Check Your ASCVD Risk
Calculate your 10-year ASCVD risk using the Pooled Cohort Equations from the 2013 ACC/AHA guideline.
Try the ASCVD Calculator →Frequently Asked Questions
Is PREVENT better than the ASCVD calculator?
Why is my PREVENT score lower than my ASCVD score?
Does PREVENT replace the ASCVD calculator?
What is the difference in accuracy between PREVENT and PCE?
Should I recalculate my heart risk with PREVENT?
Does PREVENT include heart failure risk?
Sources
- Goff DC Jr, Lloyd-Jones DM, Bennett G, et al. 2013 ACC/AHA Guideline on the Assessment of Cardiovascular Risk. Circulation. 2014;129(25 Suppl 2):S49-S73. DOI: 10.1161/01.cir.0000437741.48606.98
- Khan SS, Coresh J, Pencina MJ, et al. Novel Prediction Equations for Absolute Risk Assessment of Total Cardiovascular Disease Incorporating Cardiovascular-Kidney-Metabolic Health: A Scientific Statement From the American Heart Association. Circulation. 2024. DOI: 10.1161/CIRCULATIONAHA.123.067626
- Ndumele CE, Rangaswami J, Chow SL, et al. Cardiovascular-Kidney-Metabolic Health: A Presidential Advisory From the American Heart Association. Circulation. 2023;148(20):1606-1635. DOI: 10.1161/CIR.0000000000001184
- Grundy SM, Stone NJ, Bailey AL, et al. 2018 AHA/ACC/AACVPR/AAPA/ABC/ACPM/ADA/AGS/APhA/ASPC/NLA/PCNA Multisociety Guideline on the Management of Blood Cholesterol. Circulation. 2019;139(25):e1082-e1143. DOI: 10.1161/CIR.0000000000000625
- Muntner P, Colantonio LD, Cushman M, et al. Validation of the Atherosclerotic Cardiovascular Disease Pooled Cohort Risk Equations. JAMA. 2014;311(14):1406-1415. DOI: 10.1001/jama.2014.2630
- Jones DW, Ferdinand KC, Taler SJ, et al. 2025 AHA/ACC/AAPA/ABC/ACPM/AGS/APhA/ASH/ASPC/NMA/PCNA Guideline for the Prevention, Detection, Evaluation, and Management of High Blood Pressure in Adults. Hypertension. 2025.
- Whelton PK, Carey RM, Aronow WS, et al. 2017 ACC/AHA/AAPA/ABC/ACPM/AGS/APhA/ASH/ASPC/NMA/PCNA Guideline for the Prevention, Detection, Evaluation, and Management of High Blood Pressure in Adults. Hypertension. 2018;71(6):e13-e115. DOI: 10.1161/HYP.0000000000000065
- Pencina MJ, D'Agostino RB Sr, Larson MG, Vasan RS. Predicting the 30-Year Risk of Cardiovascular Disease: The Framingham Heart Study. Circulation. 2009;119(24):3078-3084. DOI: 10.1161/CIRCULATIONAHA.108.816694
- Comparative analyses published in 2024 applying the PCE and PREVENT equations to U.S. population data (NHANES), reporting estimated statin eligibility of approximately 45.4 million under the PCE versus 28.3 million under PREVENT using 2018 guideline thresholds.
- Arnett DK, Blumenthal RS, Albert MA, et al. 2019 ACC/AHA Guideline on the Primary Prevention of Cardiovascular Disease. Circulation. 2019;140(11):e596-e646. DOI: 10.1161/CIR.0000000000000678
Editorial review: This article was reviewed by the Heart Score Calculator Editorial Team on October 18, 2026. The professional name "Dr. Heart" identifies this editorial work and does not replace advice, diagnosis or treatment from a licensed healthcare professional.