Normal Blood Pressure by Age: Chart & Guidelines
Normal blood pressure is below 120/80 mmHg at any age under the 2017 ACC/AHA guideline. Average readings climb with age — mostly in the systolic number — so this page pairs the official category chart with decade-by-decade averages and the physiology behind the rise.
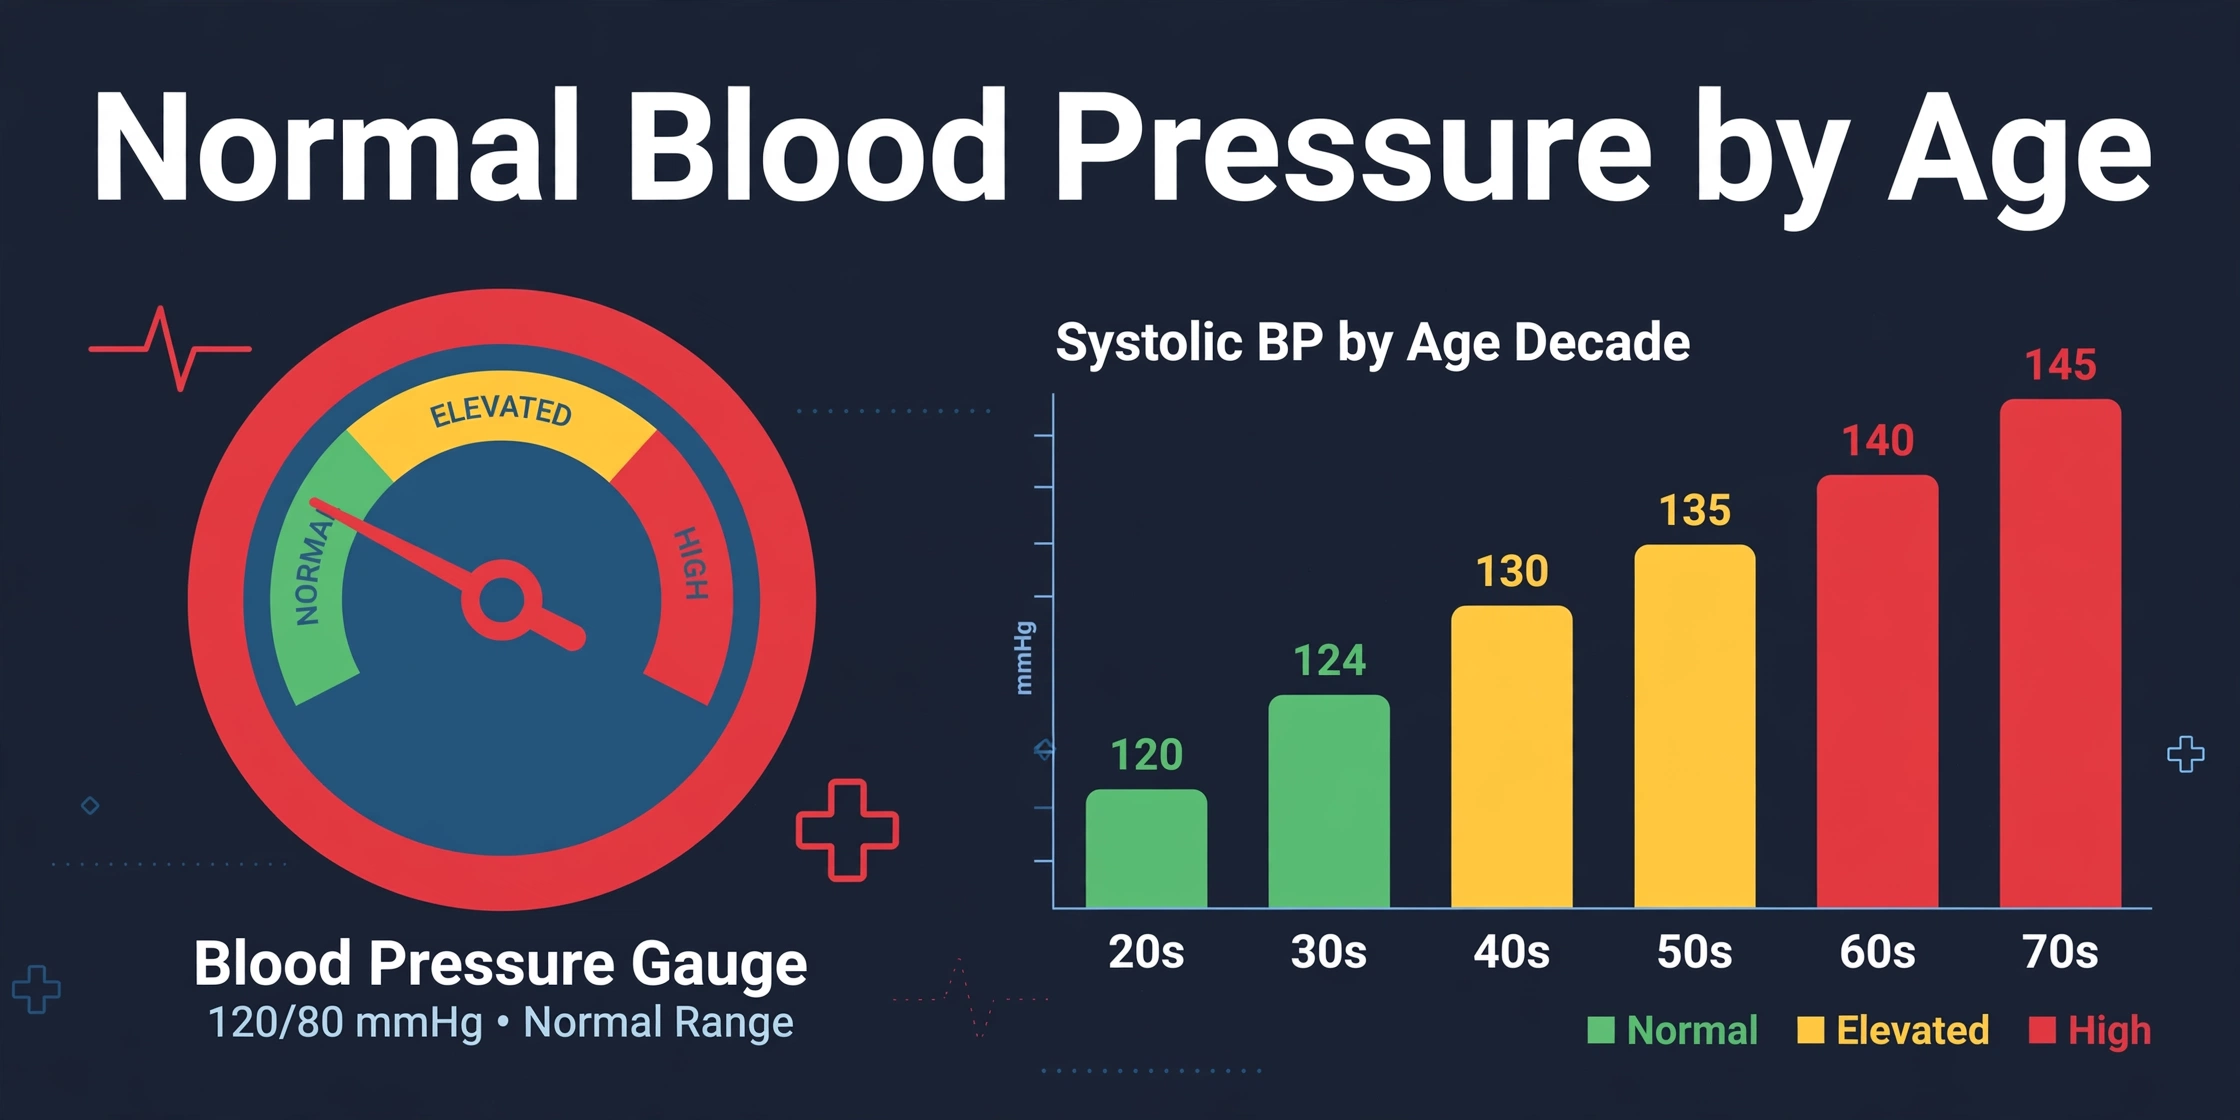
Average systolic pressure climbs steadily with age while the clinical target — below 120/80 mmHg — stays the same at every decade.
Key Takeaways
- Normal blood pressure is below 120/80 mmHg at any age under the 2017 ACC/AHA guideline.
- Stage 1 hypertension begins at 130/80 — the guideline redefined the threshold down from 140/90.
- Average systolic pressure rises every decade, while diastolic peaks near midlife and often falls after 60.
- After age 50, systolic pressure becomes the stronger predictor of cardiovascular events.
- Correct technique — seated, cuff at heart level, two readings averaged — matters as much as the number itself.
Normal blood pressure is below 120/80 mmHg at any age, according to the 2017 ACC/AHA guideline.1 Average systolic pressure in the population climbs decade by decade — mostly from arterial stiffening — while the clinical target itself does not move.
How Blood Pressure Is Measured
Blood pressure is the force of blood against artery walls, reported as two numbers in millimeters of mercury (mmHg). The top number, systolic pressure, records the peak force as the heart's ventricles contract and push blood into the aorta. The bottom number, diastolic pressure, records the minimum force between beats, while the heart relaxes and refills. Together the pair describes one full heartbeat: ejection, then recovery.
Manual measurement remains the reference method. The observer wraps a cuff around the upper arm, inflates it above the expected systolic level, then releases air slowly while listening with a stethoscope. The first tapping sound — Korotkoff Phase I — marks systolic pressure. The point where sounds disappear — Phase V — marks diastolic pressure. Because this method relies on hearing, it requires training and a quiet room, and validation studies still use it as the benchmark against which devices are tested.
Most home and clinic devices skip the listening step. Oscillometric cuffs sense tiny pressure pulses in the cuff as it deflates and run an algorithm to estimate systolic and diastolic values. These devices never detect Korotkoff sounds, so their numbers can differ slightly from a manual reading. Guidelines accept validated oscillometric devices for routine use, and independent validation lists identify models tested against manual measurement.8
The two numbers combine into one derived value: mean arterial pressure, the average pressure across the cardiac cycle. It is estimated as diastolic pressure plus one-third of the pulse pressure — the gap between systolic and diastolic. A mean arterial pressure calculator runs that arithmetic on any systolic/diastolic pair, producing the single summary value clinicians use when describing perfusion pressure.
Physiologically, systolic pressure tracks how much blood the heart ejects and how stiff the large arteries are; diastolic pressure tracks the resting tone of the small resistance vessels. The two numbers answer different questions about the circulation, which is why they often drift on different schedules as people age — a pattern the age-decade chart below makes visible.
Units matter for reading the numbers. Millimeters of mercury date to the mercury column of the original sphygmomanometer, and modern digital devices keep the unit for continuity. A reading of 120/80 therefore means arterial pressure peaked at a level that would support a 120 mm column of mercury during contraction and fell to an 80 mm column at rest. The unit is arbitrary but universal, which is why studies from any country can be compared directly.
2017 ACC/AHA Blood Pressure Categories
In 2017, the American College of Cardiology and American Heart Association released a new hypertension guideline that relabeled familiar readings. The headline change: hypertension was redefined from 140/90 mmHg — the older JNC 7 threshold — to 130/80 mmHg.1,7 Readings once filed under "prehypertension" moved into Stage 1, which shifted a large share of adults into a labeled category.
The guideline sorts every reading into one of five categories. The higher of the two numbers sets the category: a reading of 132/78 is Stage 1 because the systolic value lands in the 130–139 band, even though the diastolic value sits below 80.
| Reading (mmHg) | Category | What it means |
|---|---|---|
| <120 and <80 | Normal | Healthy range; the target at every age |
| 120–129 and <80 | Elevated | Above ideal, below the hypertension threshold |
| 130–139 or 80–89 | Stage 1 hypertension | Hypertension threshold begins here |
| ≥140 or ≥90 | Stage 2 hypertension | Higher range of hypertension |
| >180 and/or >120 | Hypertensive crisis | Severe elevation; prompt clinical evaluation |
2017 ACC/AHA blood pressure categories. The category is set by whichever number — systolic or diastolic — falls in the higher row.1

The "Elevated" row introduced new vocabulary for 120–129 with diastolic below 80. These readings sit below the hypertension threshold, yet the guideline names them separately because population studies show cardiovascular risk beginning to climb above roughly 115/75 mmHg. The Prospective Studies Collaboration and Framingham analyses behind that curve are covered in the sections below.3,11
The committee behind the 2017 guideline did not move the threshold without evidence. Population studies had shown for years that risk begins well below 140/90: Framingham data linked high-normal readings (130–139/85–89) with higher cardiovascular event rates over a decade of follow-up, and the Prospective Studies Collaboration found the risk curve starting near 115/75.1,3,11 Redefining 130/80 as hypertension aligned the label with where the data showed risk beginning.
The crisis row — above 180 and/or above 120 — flags severe elevation. The guideline treats this as a category that always calls for prompt clinical evaluation, while separating crisis with acute symptoms from severe readings without them. That distinction is covered under "When Readings Signal Concern."
🧮 Calculate Your Mean Arterial Pressure
Enter any systolic/diastolic pair to see mean arterial pressure and pulse pressure instantly.
Try the MAP Calculator →Average Blood Pressure by Age Decade
Population averages climb with age. The table below shows typical mean systolic and diastolic values by decade for U.S. adults, reflecting the age trend seen in national population surveys. These are descriptive averages — what readings commonly look like across the population — not clinical targets. Individual readings vary widely around every average.
| Age decade | Average systolic (mmHg) | Average diastolic (mmHg) |
|---|---|---|
| 20s | ~114 | ~74 |
| 30s | ~118 | ~77 |
| 40s | ~122 | ~80 |
| 50s | ~127 | ~81 |
| 60s | ~132 | ~79 |
| 70s and older | ~138 | ~75 |
Typical population averages by decade. These illustrate the age trend, not targets — the clinical target stays below 120/80 at every age.1,4

Two patterns stand out. First, systolic pressure rises every decade without pausing — roughly 4 to 6 mmHg per decade in these averages. Second, diastolic pressure climbs only until the 50s, then eases downward after about age 60. The gap between the two numbers — pulse pressure — widens steadily with age. Framingham hemodynamic analyses describe exactly this crossover, with diastolic peaking near midlife and declining afterward.4
Sex differences appear in the underlying data: men average higher systolic readings than women through middle age, while women's averages rise more steeply after midlife and converge with — or exceed — men's in older decades. The guideline categories, however, apply identically to everyone; no separate targets exist by age or sex.1
The clinical target stays below 120/80 at every age. A 70-year-old sitting near the population average of roughly 138/75 is common, not normal by guideline definition. Keeping "common" and "normal" separate is the main discipline when reading any blood pressure-by-age chart.
Why Systolic Blood Pressure Rises With Age
Large arteries are elastic, not rigid. With each heartbeat, the aorta stretches to absorb part of the pressure surge, then recoils between beats to push blood forward. This cushioning — the Windkessel effect — holds systolic pressure down and sustains diastolic pressure up. Stiff plumbing would produce higher peaks and lower troughs; healthy young arteries avoid both.
Aging remodels the wall. Elastin fibers fragment and thin out, stiffer collagen takes on more of the mechanical load, and calcium deposits accumulate in the vessel wall. The aorta absorbs less of each heartbeat's surge, so peak pressure rises. Framingham investigators tracking these hemodynamic patterns identified progressive arterial stiffening as the primary driver of the age-related systolic climb.4
Diastolic pressure follows a different curve because it depends on the recoil between beats. As the aorta stiffens, the elastic recoil that sustains pressure during rest weakens, so diastolic pressure stops climbing around midlife and declines after about age 60. Rising systolic with flat or falling diastolic is the signature pattern of vascular aging — and it produces isolated systolic hypertension, where only the top number sits in a hypertensive range.
The widening gap between the two numbers has a name: pulse pressure. It reflects large-artery stiffness directly, which is why researchers study it as a marker in its own right. The stiffening process starts early — measurable changes in arterial elasticity appear from young adulthood — so the slow systolic climb in the population table is decades in the making.
Researchers quantify stiffness with pulse wave velocity — the speed at which the pressure wave travels along the arteries. Stiffer arteries transmit the wave faster, and higher pulse wave velocity predicts cardiovascular events in population studies. It is the closest thing to a direct gauge of the stiffening process described above, and it rises steadily with age in every population studied.
Why Systolic Matters More After 50
Before middle age, diastolic pressure tracks cardiovascular risk closely. After about 50, systolic pressure takes over as the stronger predictor. Two landmark bodies of evidence established this shift.
The Prospective Studies Collaboration pooled individual data from 61 studies covering about one million adults. It found blood pressure relating to vascular mortality down to at least 115/75 mmHg, with each 20 mmHg of usual systolic pressure — or 10 mmHg of diastolic — roughly doubling vascular death rates in middle age.3 Within those analyses, systolic pressure carried relatively more predictive weight at older ages, a finding that pushed guidelines toward systolic targets in older adults.
Framingham Heart Study analyses tested the question directly. Franklin and colleagues showed that diastolic pressure predicted coronary heart disease risk more strongly before age 50, while systolic pressure dominated after 50, with pulse pressure adding further predictive information in older adults.5 In other words, the number that carries the most weight changes with age — a result that reshaped how clinicians interpret the two readings.
Pulse pressure earns its own mention as a marker. Because it mirrors arterial stiffness, a wide pulse pressure flags the same process that drives systolic readings upward. Population studies link higher pulse pressure with coronary events in older adults, independent of the individual systolic and diastolic values.5
Age also changes the shape of the risk curve itself. The Prospective Studies Collaboration found the proportional relationship between blood pressure and vascular mortality weakening with age — the relative risk per 20 mmHg shrinks in older adults even as absolute risk climbs.3 Clinicians read this as a shift from relative to absolute risk framing: at older ages, the number of events per unit of pressure matters more than the multiplier.
Risk models reflect this shift. The Heart Score Calculator on this site takes systolic blood pressure as a core input to its 10-year equations, and the broader explainer on what a good heart score looks like shows where blood pressure sits among the other risk factors. The SPRINT trial added interventional weight: among high-risk adults, targeting systolic pressure below 120 mmHg rather than below 140 reduced major cardiovascular events and all-cause mortality.2
How to Measure Blood Pressure Correctly
Technique shifts readings more than most people expect — poor measurement can skew a result by 5 to 15 mmHg, enough to move a reading across a category line. Guideline-based technique, summarized from the AHA scientific statement on measurement and the earlier Pickering recommendations, has several elements:8,10
- At least 5 minutes of seated rest beforehand, with the back supported and feet flat on the floor.
- The cuff at heart level, with the arm supported on a flat surface rather than held up.
- Correct cuff size: the inflatable bladder should encircle at least 80% of the upper arm. A cuff that is too small reads falsely high.
- No caffeine, exercise, or smoking for 30 minutes beforehand, and an emptied bladder — a full bladder raises readings.
- Silence during the measurement; talking raises readings.
- At least two readings, 1–2 minutes apart, with the average recorded.
Out-of-office measurement confirms clinic readings. Home monitoring with a validated device, following the same seated technique, builds a record across days and conditions. Twenty-four-hour ambulatory monitoring records pressure at intervals through day and night and is the reference method for detecting patterns such as nighttime dipping. Guidelines endorse both approaches for confirming readings taken in the clinic.6,8
Device choice matters less than cuff fit. The bladder inside the cuff does the actual work of occluding the artery, so fit — not screen size or brand — determines accuracy. A cuff that is too large reads falsely low, mirroring the error in the opposite direction.
"Validated" has a specific meaning here: a device counts as validated when an independent study shows its readings agreeing with manual measurement within a defined margin across a range of arm sizes and pressure levels. Published validation lists make those results searchable by model. A cuff placed over thick clothing is another common error — the cuff belongs on bare skin, or over a thin sleeve at most.
Blood pressure also moves with everyday habits — activity, sleep, caffeine, and diet all shift readings across the day. A companion piece on this site examines how everyday habits relate to blood pressure in population research.
When Readings Signal Concern
Not every high reading carries the same meaning. Where, when, and how a reading was taken shapes what clinicians make of it — which is why guidelines lean on averages and out-of-office confirmation rather than single numbers.
White-coat hypertension means high readings in the clinic with normal readings outside it; masked hypertension is the reverse — normal in the clinic, high during daily life or at home. A meta-analysis by Cohen and colleagues found white-coat hypertension associated with higher cardiovascular risk than sustained normal pressure, though lower than sustained hypertension, so the pattern still receives clinical attention.9 Masked hypertension is harder to spot precisely because clinic readings look reassuring; ambulatory or home monitoring is how it surfaces.
Readings above 180/120 mmHg sit in crisis territory. Guidelines distinguish severe elevation without acute symptoms or signs of organ injury from severe elevation with evidence of acute organ damage — such as stroke symptoms, chest pain, or sudden kidney injury. The clinical response differs between the two situations, which is why guidelines separate urgency from emergency rather than treating every severe reading identically.1
Visit-to-visit variability adds another dimension. Research by Rothwell and colleagues linked larger swings in systolic pressure between visits with stroke and cardiovascular events, independent of average pressure.12 Consistent technique across visits is what makes variability interpretable instead of noise — another reason the measurement steps above matter beyond any single reading.
Nighttime readings add one more pattern. Blood pressure normally dips 10 to 20 percent during sleep; the absence of that dip — detected only by 24-hour ambulatory monitoring — is itself associated with higher cardiovascular risk in cohort studies. Because office and daytime home readings cannot capture sleep pressure, ambulatory monitoring remains the only way to see the full 24-hour picture.
🧮 See What Your Numbers Mean
Enter your systolic and diastolic readings to calculate mean arterial pressure and pulse pressure instantly.
Try the MAP Calculator →
Frequently Asked Questions
What is normal blood pressure for a 60-year-old?
Is 130/80 high blood pressure?
Why is only my systolic blood pressure high?
Can blood pressure vary during the day?
How often should blood pressure be checked?
Sources
- Whelton PK, Carey RM, Aronow WS, et al. 2017 ACC/AHA/AAPA/ABC/ACPM/AGS/APhA/ASH/ASPC/NMA/PCNA Guideline for the Prevention, Detection, Evaluation, and Management of High Blood Pressure in Adults. Hypertension. 2018;71(6):e13-e115. DOI: 10.1161/HYP.0000000000000065
- SPRINT Research Group. A Randomized Trial of Intensive versus Standard Blood-Pressure Control. N Engl J Med. 2015;373:2103-2116. DOI: 10.1056/NEJMoa1511939
- Lewington S, Clarke R, Qizilbash N, Peto R, Collins R. Age-specific relevance of usual blood pressure to vascular mortality: a meta-analysis of individual data for one million adults in 61 prospective studies. Lancet. 2002;360:1903-1913. DOI: 10.1016/S0140-6736(02)11911-8
- Franklin SS, Gustin W 4th, Wong ND, et al. Hemodynamic patterns of age-related changes in blood pressure: the Framingham Heart Study. Circulation. 1997;96(1):308-315. DOI: 10.1161/01.CIR.96.1.308
- Franklin SS, Larson MG, Khan SA, et al. Does the relation of blood pressure to coronary heart disease risk change with aging? The Framingham Heart Study. Circulation. 2001;103(9):1245-1249. DOI: 10.1161/01.CIR.103.9.1245
- Mancia G, Kreutz R, Brunström M, et al. 2023 ESH Guidelines for the management of arterial hypertension. J Hypertens. 2023;41(12):1874-2071. DOI: 10.1097/HJH.0000000000003480
- James PA, Oparil S, Carter BL, et al. 2014 Evidence-Based Guideline for the Management of High Blood Pressure in Adults: Report From the Panel Members Appointed to the Eighth Joint National Committee (JNC 8). JAMA. 2014;311(5):507-520. DOI: 10.1001/jama.2013.284427
- Muntner P, Shimbo D, Carey RM, et al. Measurement of Blood Pressure in Humans: A Scientific Statement From the American Heart Association. Hypertension. 2019;73(5):e35-e66. DOI: 10.1161/HYP.0000000000000087
- Cohen JB, Lotito MJ, Trivedi UK, et al. Cardiovascular Events and Mortality in White Coat Hypertension: A Systematic Review and Meta-analysis. Ann Intern Med. 2019;170(12):853-862. DOI: 10.7326/M19-0223
- Pickering TG, Hall JE, Appel LJ, et al. Recommendations for blood pressure measurement in humans and experimental animals: part 1: blood pressure measurement in humans: a statement for professionals. Hypertension. 2005;45(1):142-161. DOI: 10.1161/01.HYP.0000150859.47929.8e
- Vasan RS, Larson MG, Leip EP, et al. Impact of high-normal blood pressure on the risk of cardiovascular disease. N Engl J Med. 2001;345:1291-1297. DOI: 10.1056/NEJMoa003417
- Rothwell PM, Howard SC, Dolan E, et al. Prognostic significance of visit-to-visit variability, maximum systolic blood pressure, and episodic hypertension. Lancet. 2010;375:895-905. DOI: 10.1016/S0140-6736(10)60308-X
Editorial review: This article was reviewed by the Heart Score Calculator Editorial Team on October 18, 2026. The professional name "Dr. Heart" identifies this editorial work and does not replace advice, diagnosis or treatment from a licensed healthcare professional.