10-Year vs Lifetime Heart Risk: Which Matters More?
Both matter, for different reasons. Ten-year risk guides near-term treatment decisions, while lifetime risk reveals the cumulative burden of risk factors — especially in younger adults. The PREVENT equations bridge the gap with a 30-year output.
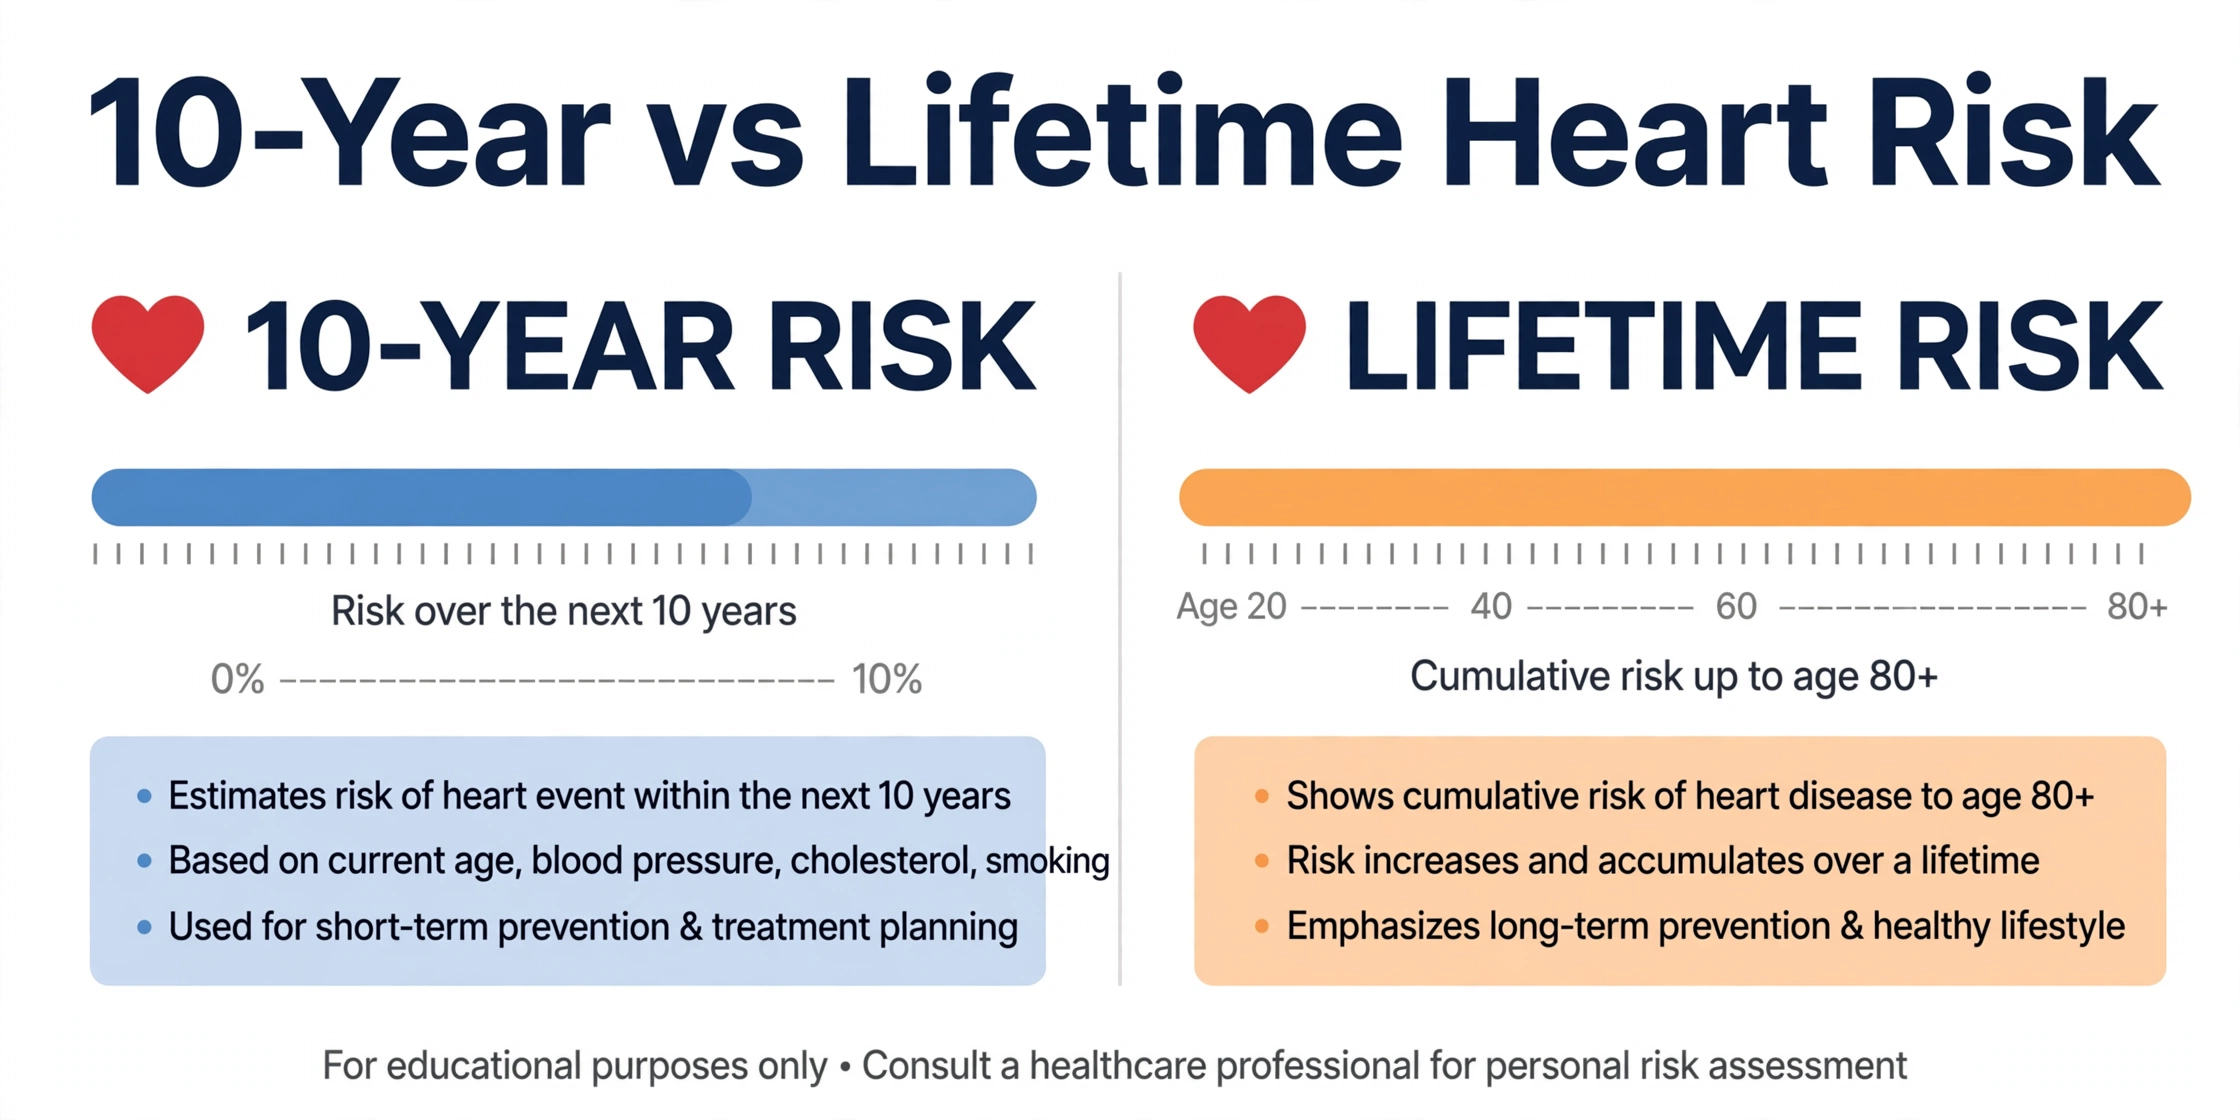
Ten-year, 30-year, and lifetime risk horizons each answer a different question about cardiovascular risk.
Key Takeaways
- Both horizons matter: 10-year risk guides near-term treatment decisions, while lifetime risk reveals the cumulative burden of risk factors.
- The Pooled Cohort Equations estimate 10-year ASCVD risk for adults aged 40 to 79, with treatment thresholds at 7.5% (intermediate) and 20% (high).
- A young adult can have low 10-year risk and still carry high lifetime risk, because age dominates short-term models.
- In the Framingham lifetime analysis, optimal risk factors at age 50 meant 5.2% lifetime risk in men versus 68.9% with two or more major risk factors.
- PREVENT's 30-year output for ages 30 to 79 bridges the gap, adding heart failure and kidney function to the estimate.
Both matter, and they answer different questions. Ten-year cardiovascular risk guides near-term treatment decisions — it is the number clinicians use when deciding whether preventive therapy is worth discussing. Lifetime risk captures the cumulative burden of risk factors across decades, which is the view that matters most for younger adults whose 10-year numbers look reassuring. The newer PREVENT equations bridge the gap with a 30-year output designed for exactly this communication problem.
Understanding the difference between these horizons changes how risk feels. A 3% 10-year risk sounds trivial. A 50% lifetime risk does not. Both numbers can describe the same person at the same visit. This article explains what each horizon measures, where the landmark evidence comes from, and how clinicians combine them in practice.
What Is 10-Year Cardiovascular Risk?
Ten-year cardiovascular risk estimates the probability of a cardiovascular event occurring within the next decade. The most widely used version is the ASCVD 10-year risk from the Pooled Cohort Equations (PCE), published in the 2013 ACC/AHA cardiovascular risk guideline.1 The outcome covers hard atherosclerotic events: nonfatal myocardial infarction, coronary heart disease death, and fatal or nonfatal stroke.
The PCE was derived from pooled data across five cohort studies, including the Framingham Heart Study, the Atherosclerosis Risk in Communities study, and the Coronary Artery Risk Development in Young Adults study. It applies to adults aged 40 to 79 without known cardiovascular disease.1 Inputs include age, sex, race (Black or White), total cholesterol, HDL cholesterol, systolic blood pressure, blood pressure treatment status, diabetes status, and current smoking status.
Guidelines built therapy thresholds directly on top of this number. The 2018 AHA/ACC cholesterol guideline defines four categories: low (below 5%), borderline (5% to 7.4%), intermediate (7.5% to 19.9%), and high (20% or higher).4 The 7.5% cutoff marks the point where clinicians begin a formal discussion about statin therapy, while 20% marks the high-risk category where more intensive management is commonly considered. A detailed breakdown of these ranges is available in our guide to heart score ranges.
The 10-year horizon was chosen deliberately. It is long enough to capture meaningful event rates but short enough to feel actionable for patients and clinicians. Therapy decisions — statins, blood pressure intensification, aspirin evaluation — require a timeframe in which benefit can be measured. A 10-year window matches the follow-up periods of most prevention trials, which makes the estimates easier to connect with trial evidence.6
Age dominates the equation. The PCE weights age heavily because cardiovascular event rates rise steeply with age in the derivation cohorts. This weighting is statistically correct for prediction, but it creates a communication problem: a 35-year-old with severely elevated LDL cholesterol can score under 2% 10-year risk. The number is mathematically honest. Whether it tells the full story is the question the rest of this article addresses.
The ASCVD 10-year risk calculator on this site implements the same Pooled Cohort Equations used in the guideline. It returns the same four-category result clinicians use as the starting point for risk discussion.
What Is Lifetime Cardiovascular Risk?
Lifetime cardiovascular risk estimates the cumulative probability of developing cardiovascular disease over the remaining lifespan, typically calculated through age 80 or 95. Instead of asking "what happens in the next 10 years," it asks "what happens over the rest of your life." The answer is always larger — sometimes dramatically so — because decades of exposure give risk factors far more time to act.
The concept exists because short-term models answer a treatment question, not a prevention question. Lifetime risk addresses a different clinical need: motivating attention to risk factors long before drug therapy is on the table. A 10-year number speaks to the next decade. A lifetime number speaks to the cumulative price of smoking, elevated blood pressure, or high cholesterol maintained for thirty years.
Calculating lifetime risk is methodologically harder than 10-year risk. Standard survival models must account for competing risks — people who die of non-cardiovascular causes can no longer have a first cardiovascular event. Without this adjustment, lifetime estimates overshoot. The Framingham researchers who first produced lifetime CVD estimates used a modified Kaplan-Meier approach that treats non-CVD death as a competing event, which keeps the estimates honest.3
Lifetime risk is also more sensitive to assumptions about future behavior. A 10-year estimate assumes risk factors stay roughly as measured. A lifetime estimate stretches that assumption over thirty to forty-five years. Risk factors do change — blood pressure rises, people quit smoking, new conditions emerge — so lifetime figures describe what happens if the current risk-factor burden persists. Clinicians frame them as "the trajectory you are on," not as a fixed destiny.
The horizon matters for interpretation. "Lifetime" in the Framingham work means risk through age 95 starting from age 50. In the Berry et al. analysis of Framingham and Chicago cohorts, lifetime risk was estimated from age 45.7 These windows differ from the 30-year horizon in PREVENT, which starts wherever the patient currently is. When comparing numbers, always check the starting age and the ending age — the timeframe defines the meaning.
The three horizons — 10-year, 30-year, and lifetime — form a progression, summarized below. Each builds on the same inputs but serves a different clinical purpose.
| Horizon | Model | Timeframe | Primary Purpose | Helps Most |
|---|---|---|---|---|
| 10-year ASCVD risk | Pooled Cohort Equations (PCE) | Next 10 years | Therapy thresholds and near-term treatment discussions | Adults 40–79 |
| 30-year total CVD risk | PREVENT Equations | Next 30 years | Bridges short and lifetime views; improves risk communication | Adults 30–79, especially younger adults |
| Lifetime CVD risk | Framingham lifetime analysis | Through age 80–95 | Cumulative burden perspective; long-term motivation | Adults 40–50 for lifetime counseling |
The Lloyd-Jones Finding
In 2006, Donald Lloyd-Jones and colleagues published the first estimates of lifetime risk for atherosclerotic cardiovascular disease, using the Framingham Heart Study cohort. They followed 3,564 men and 4,362 women who were free of cardiovascular disease at age 50, and estimated each person's probability of developing CVD through age 95, accounting for the competing risk of non-CVD death.3
The headline numbers surprised many clinicians. At age 50, lifetime risk of developing CVD was 51.7% in men and 39.2% in women — the entire remaining population average, not a high-risk subgroup. Median survival after age 50 was 30 years for men and 36 years for women. The study demonstrated that cardiovascular disease is not a rare event over a lifetime; for men it was more likely than not.
The more important finding was how risk-factor burden shifted those averages. Compared with participants carrying two or more major risk factors, those with optimal levels — total cholesterol below 180 mg/dL, blood pressure below 120/80 mm Hg, no smoking, no diabetes — had lifetime risks of only 5.2% in men and 8.2% in women, versus 68.9% and 50.2% with heavy burden.3 Median survival stretched beyond 39 years in the optimal group, versus 28 years for men with two or more major risk factors.
The gradient between optimal and heavy burden is the finding's real message. Lifetime risk is not a fixed property of aging — it is overwhelmingly a function of risk-factor burden. A 45-point gap separated the best and worst profiles in men. That gap is where prevention lives. The authors concluded that preventing the development of risk factors in young people, rather than treating them later, should be the priority.
A 2012 analysis by Berry and colleagues extended the work across Framingham, the Chicago Heart Association Detection Project, and other cohorts, estimating lifetime risks from age 45. The pattern held: aggregate burden at middle age strongly determined the lifetime probability of cardiovascular disease, and favorable profiles were associated with substantially lower risk.7 The consistency across cohorts and decades of follow-up gives the lifetime-risk concept unusual evidentiary weight.
The table below reproduces the study's lifetime-risk stratification — the clearest published picture of how burden at age 50 maps to lifetime probability. Figures are illustrative of the Framingham cohort and describe risk through age 95 with competing mortality accounted for.3
| Risk-Factor Burden at Age 50 | Lifetime CVD Risk — Men | Lifetime CVD Risk — Women |
|---|---|---|
| All optimal (BP <120/80, cholesterol <180 mg/dL, nonsmoker, nondiabetic) | 5.2% | 8.2% |
| ≥1 not-optimal risk factor | 36.4% | 26.9% |
| ≥1 elevated risk factor | 45.5% | 39.1% |
| 1 major risk factor | 50.4% | 38.8% |
| ≥2 major risk factors | 68.9% | 50.2% |
The same figures tell a second story about sex differences. At every burden level, women's lifetime risks run lower than men's — 8.2% versus 5.2% at optimal, widening to 50.2% versus 68.9% at heavy burden. This reflects later onset of cardiovascular events in women in the Framingham data, though the burden gradient applies to both sexes equally.
Why 10-Year Risk Misleads Young Adults
Consider a 35-year-old man with LDL cholesterol of 190 mg/dL, normal blood pressure, no smoking, and no diabetes. His 10-year ASCVD risk is under 2%. The number is accurate: a cardiovascular event in the next ten years is genuinely unlikely at his age. The number is also incomplete: if his cholesterol stays elevated, his lifetime trajectory points toward the heavy-burden end of the Lloyd-Jones table.3
This is the core failure mode of the 10-year horizon. Age is the strongest driver in the Pooled Cohort Equations, so youth itself suppresses the score. Risk factors that need decades to cause damage — elevated cholesterol most of all — barely register at age 35 but compound relentlessly. Atherosclerosis is a cumulative process: LDL particles accumulate in arterial walls over years, and the damage does not reset each decade.
Guidelines acknowledge this blind spot. The 2019 ACC/AHA primary prevention guideline notes that 10-year risk estimation may underestimate risk in younger adults with significant risk-factor burden, and discusses lifetime risk as a complementary tool for risk communication.6 The 2018 cholesterol guideline similarly frames lifetime risk as a way to convey the long-term stakes of elevated LDL in younger patients, even while keeping 10-year thresholds as the basis for therapy decisions.4
The practical consequence is under-recognition. Young adults with severe single risk factors — familial hypercholesterolemia, heavy smoking, uncontrolled hypertension — can look "low risk" on a 10-year printout. Their clinicians know better, but the number itself can reassure patients into inaction. Lifetime or 30-year framing exists to correct that specific misimpression.
This is also where the Heart Age Calculator earns its place. Heart age translates a young person's risk-factor burden into the age of someone whose risk profile matches theirs — "your arteries look 12 years older than you." It conveys the same long-horizon message as lifetime risk, in a format that younger adults find easier to grasp than percentages.
🧮 See Your 30-Year Horizon
Calculate 10-year and 30-year total cardiovascular risk with the PREVENT equations — including heart failure and kidney function.
Try the PREVENT Calculator →PREVENT's 30-Year Output
The American Heart Association's PREVENT equations, developed and validated by Khan and colleagues in 2024, added a genuinely new option: a 30-year risk estimate alongside the traditional 10-year one.2 The model covers total cardiovascular disease — atherosclerotic events plus heart failure — for adults aged 30 to 79 without known CVD. By extending the window to 30 years, PREVENT gives younger adults a horizon long enough to show the consequences of today's risk factors.
PREVENT differs from the PCE in three structural ways. First, it removes race as a predictor, using sex-specific but race-free equations. Second, it adds estimated glomerular filtration rate (eGFR) as a kidney-function predictor, reflecting the cardiovascular-kidney-metabolic (CKM) health framework the AHA formalized in a 2023 presidential advisory.8 Third, optional add-on models accept hemoglobin A1c, urine albumin-to-creatinine ratio, and a social deprivation index when those measures are available.2
The 30-year output was designed for the exact communication gap described above. A 35-year-old with elevated cholesterol sees a low 10-year number and a meaningfully higher 30-year number side by side. The contrast itself does the communicating — no separate lifetime table needed. Recent work deriving age- and sex-specific percentiles for 30-year PREVENT risk found that percentile framing may further improve how patients perceive long-term risk, though the authors note that prospective studies are still needed to test whether it changes decisions.10
The 30-year horizon also captures heart failure, which the PCE does not estimate. Heart failure risk rises with age and is strongly influenced by hypertension, diabetes, and kidney dysfunction — factors PREVENT models explicitly. For adults with chronic kidney disease or diabetes, the total-CVD framing gives a more complete picture than ASCVD-only models.2
The PREVENT calculator on this site implements these equations and returns both the 10-year and 30-year estimates. Comparing the two numbers for the same person is the simplest way to see what the horizon choice changes.
The 2025 AHA/ACC hypertension guideline adopted PREVENT as its preferred risk model for treatment decisions, replacing the PCE for most patients aged 40 to 75.5 That adoption signals how seriously guidelines now take the longer-horizon view: risk communication and risk estimation are converging on the same tool.
Which Horizon Should Guide Decisions?
Guidelines still use the 10-year horizon for therapy thresholds, and that is unlikely to change soon. The reason is practical, not philosophical: clinical trials test interventions over years, not decades. Statin benefit, blood pressure lowering, and aspirin evaluation all rest on evidence measured in roughly 5- to 10-year windows. A threshold built on a 30-year number would be making promises the trial data cannot keep.
The cholesterol guideline's structure illustrates the division of labor. The 7.5% 10-year threshold triggers a clinician-patient discussion about statin therapy; the 20% threshold defines high risk.4 Lifetime risk enters the same guideline as a communication tool — a way to convey the long-term stakes to younger patients with elevated LDL — not as a treatment threshold. The number that opens the therapy conversation remains the 10-year one.
Lifetime and 30-year estimates play a different role: they shape the intensity of the prevention conversation. A young adult with low 10-year risk but high 30-year risk may hear more about sustained lifestyle measures, earlier follow-up, and tighter blood pressure or cholesterol goals within the normal range. Guidelines frame this as shared decision-making, where the patient's values and the long-term picture both inform the plan.6
There is an honest tension here that guidelines do not hide. The same evidence base that makes 10-year thresholds rigorous makes lifetime thresholds speculative — no trial has randomized people to lifetime-risk-guided therapy. Until such evidence exists, treatment thresholds will stay anchored to the 10-year window, while longer horizons serve communication. Both roles are legitimate; they are simply different jobs.
Clinicians also weigh factors no equation captures: coronary artery calcium, lipoprotein(a), family history of premature disease, inflammatory markers, and pregnancy complications. These risk-enhancing factors can shift a patient across a threshold regardless of the horizon used. The 2018 cholesterol guideline catalogues them explicitly as modifiers to the calculated 10-year risk.4 A Framingham risk estimate adds another established model to this evaluation, particularly for coronary heart disease outcomes.
Using Both Horizons Together
The practical answer to "which matters more" is to stop choosing. Ten-year risk and lifetime or 30-year risk are complementary views of the same risk-factor profile, and clinicians get more from the pair than from either alone. The 10-year number anchors decisions. The longer number supplies perspective. Together they prevent both overreaction to a distant risk and complacency about a near-term one.
A useful mental model: the 10-year risk is the weather forecast, the lifetime risk is the climate. Nobody plans a wardrobe around the climate alone, and nobody pretends a sunny week means winter is cancelled. Cardiovascular risk works the same way. Short-horizon numbers guide near-term actions; long-horizon numbers describe the conditions those actions will operate in.
Patients often discuss both numbers with their clinician in a single visit. A typical framing runs: "Your 10-year risk is 6% — below the threshold where we usually discuss medication — but your 30-year risk is 38%, which reflects what your current cholesterol and blood pressure would mean over three decades." The first number answers "do we treat now." The second answers "does this deserve attention." Both answers can be true at once.
Tracking both horizons over time is where the combination pays off most. When a patient improves diet, increases activity, or starts therapy, the 10-year number moves first and most visibly — feedback that reinforces the change. The 30-year number moves too, showing that the trajectory itself has shifted. Rechecking risk every few years, as guidelines suggest for primary prevention, keeps both views current.6
The bottom line is arithmetic, not philosophy. Atherosclerosis accumulates over decades, so the risk factors that matter at age 35 are the same ones that matter at age 55 — only the timeline to consequences differs. Using both horizons means reading the same profile twice: once for the decade ahead, once for the decades after. Clinicians who do this give younger patients the one thing a 10-year number cannot: an honest picture of where the current path leads.
🧮 Check Your 10-Year ASCVD Risk
Calculate your 10-year risk of atherosclerotic cardiovascular disease using the Pooled Cohort Equations.
Try the ASCVD Calculator →Frequently Asked Questions
What is the difference between 10-year and lifetime heart risk?
Why can 10-year risk be low while lifetime risk is high?
What is the PREVENT calculator's 30-year risk estimate?
Does a high lifetime risk mean preventive therapy is needed?
How often should heart risk scores be recalculated?
Sources
- Goff DC Jr, Lloyd-Jones DM, Bennett G, et al. 2013 ACC/AHA Guideline on the Assessment of Cardiovascular Risk. Circulation. 2014;129(25 Suppl 2):S49-S73. DOI: 10.1161/01.cir.0000437741.48606.98
- Khan SS, Matsushita K, Sang Y, et al. Development and Validation of the American Heart Association's PREVENT Equations. Circulation. 2024;149(6):430-449. DOI: 10.1161/CIRCULATIONAHA.123.067626
- Lloyd-Jones DM, Leip EP, Larson MG, et al. Prediction of Lifetime Risk for Cardiovascular Disease by Risk Factor Burden at 50 Years of Age. Circulation. 2006;113(6):791-798. DOI: 10.1161/CIRCULATIONAHA.105.548206
- Grundy SM, Stone NJ, Bailey AL, et al. 2018 AHA/ACC/AACVPR/AAPA/ABC/ACPM/ADA/AGS/APhA/ASPC/NLA/PCNA Guideline on the Management of Blood Cholesterol. Circulation. 2019;139(25):e1082-e1143. DOI: 10.1161/CIR.0000000000000625
- Jones DW, Ferdinand KC, Taler SJ, et al. 2025 AHA/ACC/AANP/AAPA/ABC/ACCP/ACPM/AGS/AMA/ASPC/NMA/PCNA/SGIM Guideline for the Prevention, Detection, Evaluation, and Management of High Blood Pressure in Adults. Circulation. 2025;152(11):e114-e218. DOI: 10.1161/cir.0000000000001356
- Arnett DK, Blumenthal RS, Albert MA, et al. 2019 ACC/AHA Guideline on the Primary Prevention of Cardiovascular Disease. Circulation. 2019;140(11):e596-e646. DOI: 10.1161/CIR.0000000000000678
- Berry JD, Dyer A, Cai X, et al. Lifetime Risks of Cardiovascular Disease. N Engl J Med. 2012;366(4):321-329. DOI: 10.1056/NEJMoa1012848
- Ndumele CE, Rangaswami J, Chow SL, et al. Cardiovascular-Kidney-Metabolic Health: A Presidential Advisory From the American Heart Association. Circulation. 2023;148(20):1606-1635. DOI: 10.1161/CIR.0000000000001184
- D'Agostino RB Sr, Vasan RS, Pencina MJ, et al. General Cardiovascular Risk Profile for Use in Primary Care: The Framingham Heart Study. Circulation. 2008;117(6):743-753. DOI: 10.1161/CIRCULATIONAHA.107.699579
- Krishnan V, Huang X, Zhang S, et al. Age and Sex-Specific Percentiles of 30-Year Cardiovascular Disease Risk Based on the PREVENT Equations. J Am Coll Cardiol. 2025;86(21):2017-2027. DOI: 10.1016/j.jacc.2025.09.1509
Editorial review: This article was reviewed by the Heart Score Calculator Editorial Team on October 18, 2026. The professional name "Dr. Heart" identifies this editorial work and does not replace advice, diagnosis or treatment from a licensed healthcare professional.