A1C to Average Glucose: Conversion Chart
An A1C of 7.0% converts to an estimated average glucose (eAG) of about 154 mg/dL (8.5 mmol/L). This chart covers A1C from 4.0% to 14.0%, with the ADAG conversion formula explained step by step.
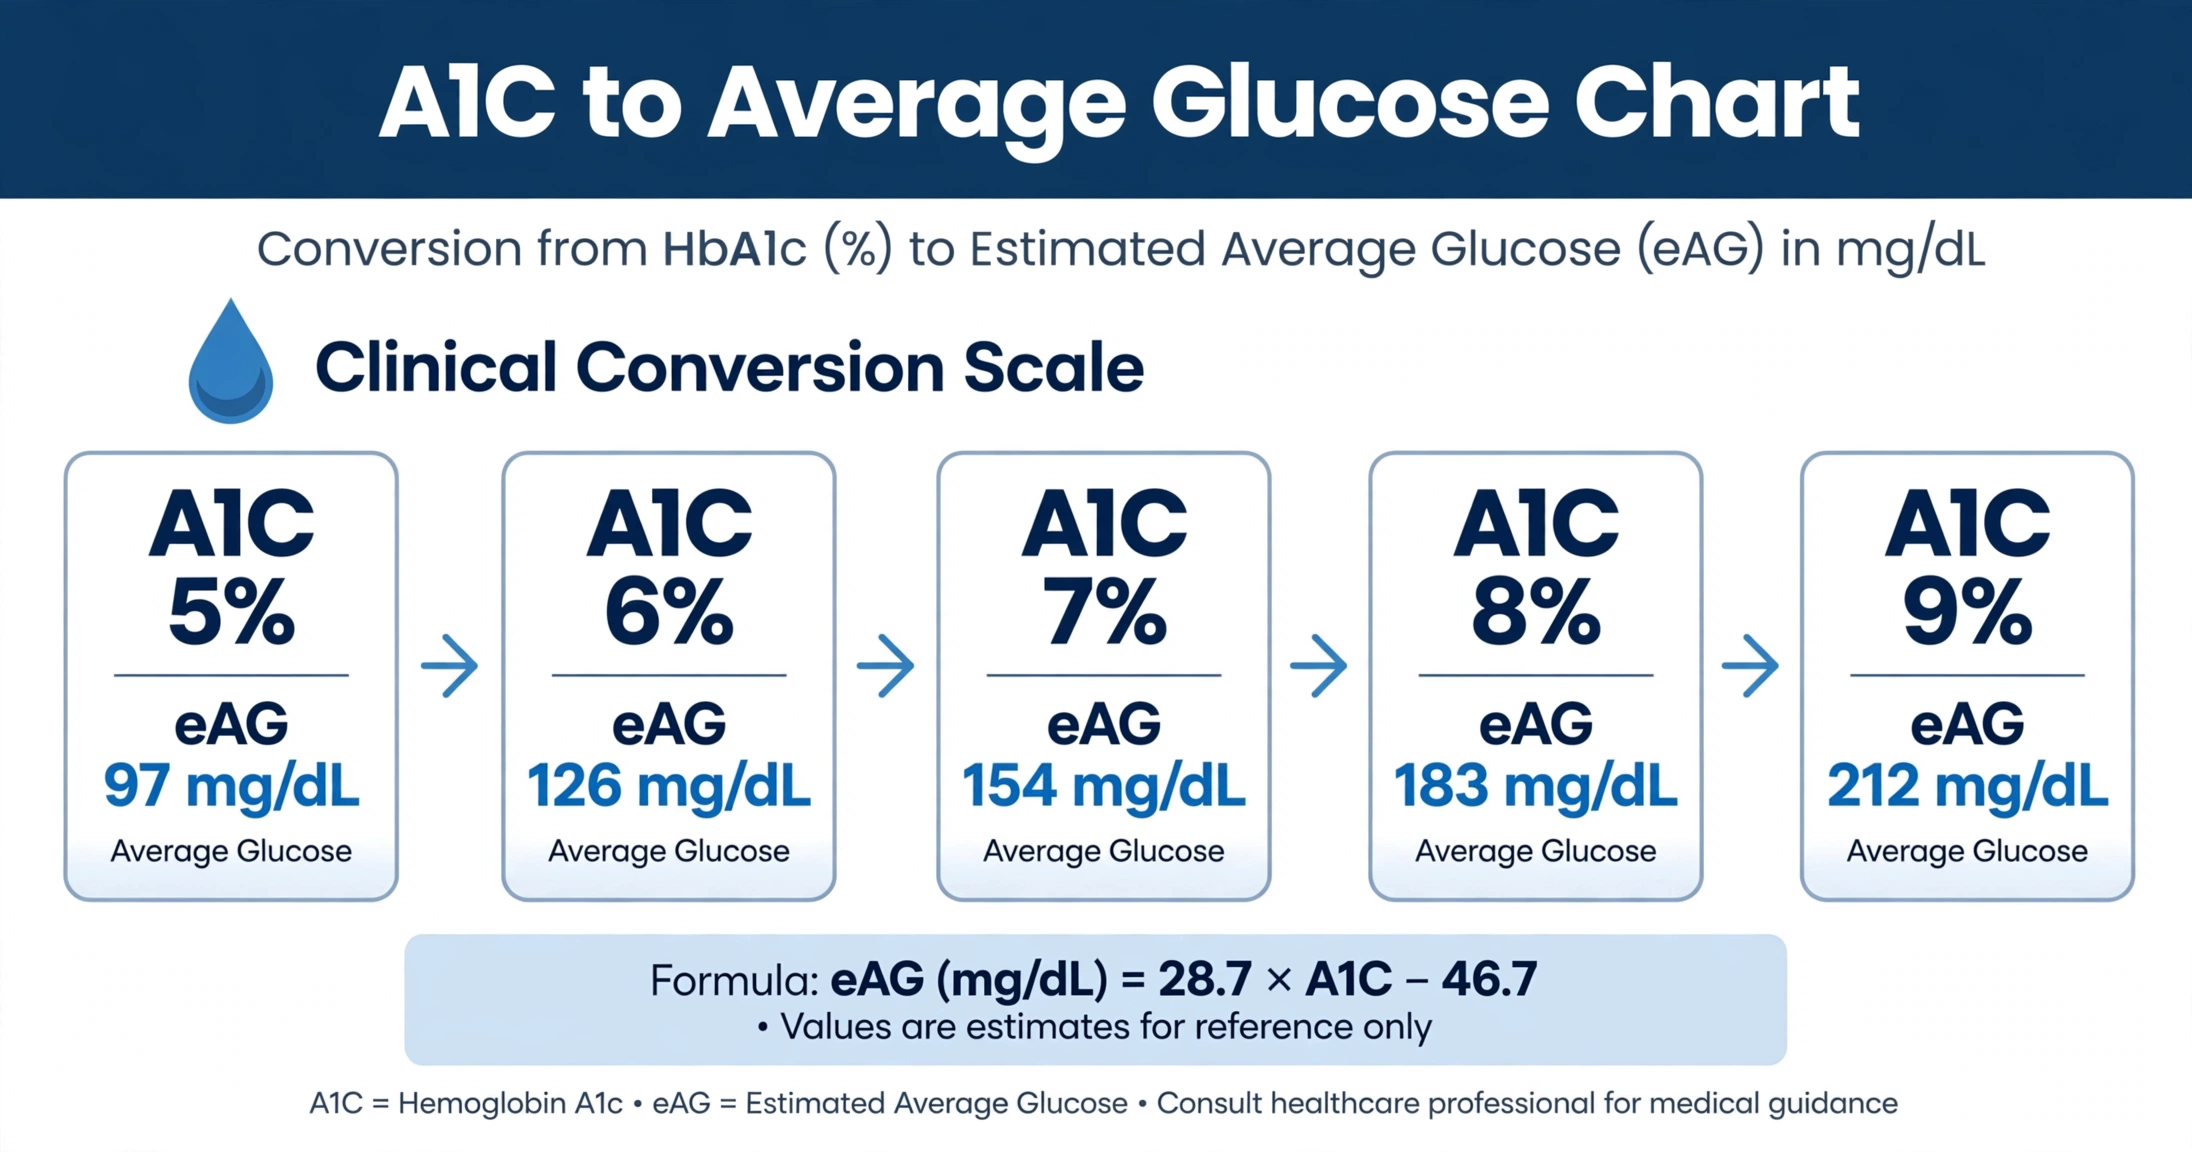
The A1C to estimated average glucose (eAG) conversion chart, based on the ADAG equation: eAG (mg/dL) = 28.7 × A1C − 46.7.
Key Takeaways
- An A1C of 7.0% equals an estimated average glucose of 154 mg/dL (8.5 mmol/L).
- The ADAG formula converts A1C to eAG: eAG (mg/dL) = 28.7 × A1C − 46.7.
- The A1C blood test reflects average blood glucose over approximately 2 to 3 months.
- Anemia, hemoglobin variants, pregnancy, and chronic kidney disease can make A1C less reliable.
- eAG is a formula-based estimate and may differ from home glucose meter averages.
An A1C of 7.0% converts to an estimated average glucose (eAG) of 154 mg/dL, or 8.5 mmol/L. This single conversion sits at the center of diabetes conversations because it translates a laboratory percentage into the same units people see on a glucose meter.
The link between A1C and average glucose comes from the ADAG study, published in 2008, which paired continuous glucose monitoring with thousands of fingerstick readings and derived a linear equation from the results.1 The table below applies that equation across the full range of A1C values, from 4.0% to 14.0%, in both mg/dL and mmol/L.
What Is A1C?
A1C — also written HbA1c — is a blood test that estimates average blood glucose over the previous 2 to 3 months. It measures the percentage of hemoglobin, the oxygen-carrying protein in red blood cells, that has glucose attached to it.9
Glucose in the bloodstream attaches to hemoglobin through a process called glycation. Because red blood cells live for about 120 days, the proportion of glycated hemoglobin reflects the average glucose concentration those cells were exposed to during their lifespan. More glucose in the blood means more glycation, which produces a higher A1C percentage.
The test requires a small blood sample drawn in a laboratory, and no fasting is needed beforehand. Results are reported as a percentage under the NGSP system used in the United States, or in millimoles per mole (mmol/mol) under the IFCC system used in many other countries. The two scales describe the same measurement: an A1C of 7.0% equals 53 mmol/mol under the IFCC system. The IFCC method became the international reference through a 2007 consensus of the American Diabetes Association, the European Association for the Study of Diabetes, the International Federation of Clinical Chemistry and Laboratory Medicine, and the International Diabetes Federation.2
Clinicians use A1C both to identify elevated average glucose and to track changes across visits.9 Because the test reflects a multi-month average, it is less affected by a single meal or a stressful day than one glucose reading. Some laboratories report A1C alongside the estimated average glucose (eAG), so the result appears in the same units used at home. For people in the prediabetes A1C range, even small differences in percentage points translate into meaningful shifts in average glucose.
The ADA Standards of Care include A1C among the tests used to identify diabetes and prediabetes, alongside fasting glucose and the oral glucose tolerance test.3 For people already living with diabetes, repeated A1C measurements create a long-term record of average glucose that complements daily meter or sensor readings. Standardized methods keep results comparable across laboratories, a point emphasized in reviews of A1C analytical performance.6
The ADAG Formula Explained
The ADAG study — short for A1C-Derived Average Glucose — was published in 2008 by Nathan and colleagues in Diabetes Care. The researchers combined continuous glucose monitoring with frequent fingerstick measurements in 507 adults with and without diabetes, collecting roughly 2,700 glucose readings per participant over three months.1 From this data set, they derived a linear equation that converts any A1C value into an estimated average glucose.
The resulting equation is simple arithmetic:
eAG (mmol/L) = eAG (mg/dL) ÷ 18.018
The divisor 18.018 converts milligrams per deciliter to millimoles per liter, based on the molecular weight of glucose. Both forms of the equation describe the same relationship; only the units differ.

For an A1C of 7.0%, the math works out as follows. Multiply 28.7 by 7.0 to get 200.9, then subtract 46.7 to get 154.2. Rounded to the nearest whole number, the eAG is 154 mg/dL. Dividing 154 by 18.018 gives 8.5 mmol/L. This is why clinical tables list A1C 7.0% alongside 154 mg/dL (8.5 mmol/L).
The ADAG equation describes the average relationship across the study population. Individual results scatter around the line: for a given A1C, the actual average glucose of individuals in the study varied by a meaningful margin.1 Sacks later compared A1C and glucose testing directly and noted that the conversion works best as a population-level estimate rather than a personal guarantee.5 Clinicians treat eAG as a useful translation of A1C into familiar units, not as a replacement for measured glucose. The interactive HbA1c calculator on this site applies the same ADAG equation, converting between A1C percentage, eAG, and IFCC units.
🧮 Convert Your A1C
Enter your A1C to get your estimated average glucose in mg/dL and mmol/L.
Try the HbA1c Calculator →Full A1C to eAG Conversion Table
The table below lists every A1C value from 4.0% to 14.0% in 0.1% steps, with the corresponding estimated average glucose in both mg/dL and mmol/L. Each row is calculated directly from the ADAG equation: eAG (mg/dL) = 28.7 × A1C − 46.7, rounded to the nearest whole number, with mmol/L obtained by dividing by 18.018 and rounding to one decimal place.1
Three landmark values are highlighted. An A1C of 5.7% (117 mg/dL) marks the lower edge of the prediabetes range, 6.5% (140 mg/dL) is the commonly used diabetes threshold, and 7.0% (154 mg/dL) is the A1C goal the ADA suggests for most nonpregnant adults with diabetes.34
| A1C (%) | eAG (mg/dL) | eAG (mmol/L) |
|---|---|---|
| 4.0% | 68 | 3.8 |
| 4.1% | 71 | 3.9 |
| 4.2% | 74 | 4.1 |
| 4.3% | 77 | 4.3 |
| 4.4% | 80 | 4.4 |
| 4.5% | 82 | 4.6 |
| 4.6% | 85 | 4.7 |
| 4.7% | 88 | 4.9 |
| 4.8% | 91 | 5.1 |
| 4.9% | 94 | 5.2 |
| 5.0% | 97 | 5.4 |
| 5.1% | 100 | 5.6 |
| 5.2% | 103 | 5.7 |
| 5.3% | 105 | 5.8 |
| 5.4% | 108 | 6.0 |
| 5.5% | 111 | 6.2 |
| 5.6% | 114 | 6.3 |
| 5.7% | 117 | 6.5 |
| 5.8% | 120 | 6.7 |
| 5.9% | 123 | 6.8 |
| 6.0% | 125 | 6.9 |
| 6.1% | 128 | 7.1 |
| 6.2% | 131 | 7.3 |
| 6.3% | 134 | 7.4 |
| 6.4% | 137 | 7.6 |
| 6.5% | 140 | 7.8 |
| 6.6% | 143 | 7.9 |
| 6.7% | 146 | 8.1 |
| 6.8% | 148 | 8.2 |
| 6.9% | 151 | 8.4 |
| 7.0% | 154 | 8.5 |
| 7.1% | 157 | 8.7 |
| 7.2% | 160 | 8.9 |
| 7.3% | 163 | 9.0 |
| 7.4% | 166 | 9.2 |
| 7.5% | 169 | 9.4 |
| 7.6% | 171 | 9.5 |
| 7.7% | 174 | 9.7 |
| 7.8% | 177 | 9.8 |
| 7.9% | 180 | 10.0 |
| 8.0% | 183 | 10.2 |
| 8.1% | 186 | 10.3 |
| 8.2% | 189 | 10.5 |
| 8.3% | 192 | 10.7 |
| 8.4% | 194 | 10.8 |
| 8.5% | 197 | 10.9 |
| 8.6% | 200 | 11.1 |
| 8.7% | 203 | 11.3 |
| 8.8% | 206 | 11.4 |
| 8.9% | 209 | 11.6 |
| 9.0% | 212 | 11.8 |
| 9.1% | 214 | 11.9 |
| 9.2% | 217 | 12.0 |
| 9.3% | 220 | 12.2 |
| 9.4% | 223 | 12.4 |
| 9.5% | 226 | 12.5 |
| 9.6% | 229 | 12.7 |
| 9.7% | 232 | 12.9 |
| 9.8% | 235 | 13.0 |
| 9.9% | 237 | 13.2 |
| 10.0% | 240 | 13.3 |
| 10.1% | 243 | 13.5 |
| 10.2% | 246 | 13.7 |
| 10.3% | 249 | 13.8 |
| 10.4% | 252 | 14.0 |
| 10.5% | 255 | 14.2 |
| 10.6% | 258 | 14.3 |
| 10.7% | 260 | 14.4 |
| 10.8% | 263 | 14.6 |
| 10.9% | 266 | 14.8 |
| 11.0% | 269 | 14.9 |
| 11.1% | 272 | 15.1 |
| 11.2% | 275 | 15.3 |
| 11.3% | 278 | 15.4 |
| 11.4% | 280 | 15.5 |
| 11.5% | 283 | 15.7 |
| 11.6% | 286 | 15.9 |
| 11.7% | 289 | 16.0 |
| 11.8% | 292 | 16.2 |
| 11.9% | 295 | 16.4 |
| 12.0% | 298 | 16.5 |
| 12.1% | 301 | 16.7 |
| 12.2% | 303 | 16.8 |
| 12.3% | 306 | 17.0 |
| 12.4% | 309 | 17.1 |
| 12.5% | 312 | 17.3 |
| 12.6% | 315 | 17.5 |
| 12.7% | 318 | 17.6 |
| 12.8% | 321 | 17.8 |
| 12.9% | 324 | 18.0 |
| 13.0% | 326 | 18.1 |
| 13.1% | 329 | 18.3 |
| 13.2% | 332 | 18.4 |
| 13.3% | 335 | 18.6 |
| 13.4% | 338 | 18.8 |
| 13.5% | 341 | 18.9 |
| 13.6% | 344 | 19.1 |
| 13.7% | 346 | 19.2 |
| 13.8% | 349 | 19.4 |
| 13.9% | 352 | 19.5 |
| 14.0% | 355 | 19.7 |
How to Use This Chart
Reading the chart starts with finding the A1C percentage in the left column and scanning across to the eAG columns. A person with an A1C of 8.2%, for example, finds an eAG of 189 mg/dL (10.5 mmol/L). The table works the same way in reverse: someone whose meter shows a long-term average near 189 mg/dL can look up the closest A1C row, which is 8.2%.

The mg/dL column is used primarily in the United States, while most other countries report glucose in mmol/L. The two columns describe the same quantity — 154 mg/dL and 8.5 mmol/L are the same glucose concentration expressed in different units. Converting between them uses the fixed factor 18.018, so any row can be translated in either direction.
Comparing the chart value with a meter or sensor average is a common sanity check. When both cover the same period and glucose is relatively stable, the two numbers often land close together. When they differ, the usual explanations are incomplete meter data — readings taken only at convenient times miss overnight and post-meal glucose — or a condition that affects A1C accuracy. Sacks noted that meter averages depend entirely on when and how often readings are taken, while A1C integrates glucose continuously over weeks.5
Clinicians use the chart to translate a laboratory result into language people already use at home. A result of 7.4% becomes "about 166 mg/dL on average," which connects directly to the numbers on a meter. The chart also shows what a change in A1C means in everyday units: each 1.0 percentage point of A1C equals roughly 29 mg/dL of average glucose, so moving from 8.0% to 7.0% represents a drop of about 29 mg/dL.
Diabetes is also a major input in cardiovascular risk models, so people tracking A1C often review their ASCVD risk scores alongside their glucose numbers. The site's 10-year ASCVD risk calculator estimates cardiovascular risk from age, blood pressure, cholesterol, smoking, and diabetes status. Because kidney function influences both A1C reliability and cardiovascular risk, some readers also check the GFR calculator for an estimate of kidney function.
Limitations of A1C Conversion
The ADAG equation assumes a normal red blood cell lifespan and a typical relationship between glucose and glycation. When those assumptions break down, the converted eAG can mislead. Radin's 2014 review in the Journal of General Internal Medicine cataloged the main situations where A1C results may not reflect true average glucose.7
Anemia and other conditions that change red blood cell turnover are the most common confounders. Iron deficiency anemia can falsely raise A1C, while hemolytic anemia, blood loss, or a recent transfusion shorten red cell lifespan and can falsely lower it, because younger cells have had less time to accumulate glucose.7 In these situations, the table's conversion describes what the A1C would mean in a person with normal red cell turnover — not necessarily that person's true average glucose.
Hemoglobin variants such as HbS, HbC, and HbE, along with chemically modified hemoglobins, can interfere with some A1C assay methods. Whether a variant causes a problem depends on the specific assay technology; some methods are unaffected while others show bias.67 Laboratories usually note known interferences, and clinicians consider alternative markers when a variant is present.
Pregnancy changes red blood cell turnover and glucose physiology, which limits how well A1C reflects average glucose during gestation. Iron deficiency is common in pregnancy and can further distort results. Guidelines describe pregnancy-specific glucose targets and monitoring approaches rather than relying on standard A1C conversion.4
Chronic kidney disease affects A1C through several mechanisms, including shortened red cell survival, anemia, and uremia-related changes in glycation. The KDIGO 2022 guideline for diabetes management in CKD discusses these limitations and notes alternative markers, such as glycated albumin or continuous glucose monitoring, where available.8
Rapid glucose changes also limit interpretation. A1C reflects a 2 to 3 month weighted average in which recent weeks contribute more, so a person whose glucose improved sharply in the last month will have an A1C that understates the improvement, and one whose control recently worsened will see the opposite effect. The conversion table describes the steady-state relationship; it cannot reconstruct recent swings.
These limitations are why eAG is called an estimate. The ADAG study itself quantified the spread of individual glucose values around the regression line, a reminder that a formula describes populations precisely and individuals approximately.1 Clinicians weigh A1C alongside meter data, symptoms, and clinical context rather than treating the converted number as exact.
🧮 Convert Your A1C to Average Glucose
The HbA1c calculator converts between A1C percentage, eAG, and IFCC units in both directions.
Try the HbA1c Calculator →
Frequently Asked Questions
Why doesn't my meter average match my A1C?
What is a good A1C?
Is eAG the same as daily glucose readings?
How often should A1C be tested?
Sources
- Nathan DM, Kuenen J, Borg R, Zheng H, Schoenfeld D, Heine RJ. Translating the A1C assay into estimated average glucose values. Diabetes Care. 2008;31(8):1473-1478. DOI: 10.2337/dc08-0545
- American Diabetes Association, European Association for the Study of Diabetes, International Federation of Clinical Chemistry and Laboratory Medicine, International Diabetes Federation. Consensus statement on the worldwide standardization of the hemoglobin A1C measurement. Diabetes Care. 2007;30(9):2399-2400. DOI: 10.2337/dc07-9925
- American Diabetes Association. Standards of Care in Diabetes—2024. Diabetes Care. 2024;47(Suppl.1). DOI: 10.2337/dc24-SINT
- American Diabetes Association. 6. Glycemic Goals and Hypoglycemia: Standards of Care in Diabetes—2024. Diabetes Care. 2024;47(Suppl.1):S111-S125. DOI: 10.2337/dc24-S006
- Sacks DB. A1C versus glucose testing: a comparison. Diabetes Care. 2011;34(2):518-523. DOI: 10.2337/dc10-1546
- Weykamp C. HbA1c: a review of analytical and clinical aspects. Ann Lab Med. 2013;33(6):393-400. DOI: 10.3343/alm.2013.33.6.393
- Radin MS. Pitfalls in hemoglobin A1c measurement: when results may be misleading. J Gen Intern Med. 2014;29(2):388-394. DOI: 10.1007/s11606-013-2595-x
- Kidney Disease: Improving Global Outcomes (KDIGO) Diabetes Work Group. KDIGO 2022 Clinical Practice Guideline for Diabetes Management in Chronic Kidney Disease. Kidney Int. 2022;102(4S):S1-S127. DOI: 10.1016/j.kint.2022.06.008
- National Institute of Diabetes and Digestive and Kidney Diseases. The A1C Test & Diabetes. NIDDK: The A1C Test & Diabetes
Editorial review: This article was reviewed by the Heart Score Calculator Editorial Team on October 18, 2026. The professional name "Dr. Heart" identifies this editorial work and does not replace advice, diagnosis or treatment from a licensed healthcare professional.