What Is Heart Age? How to Calculate Yours
Heart age translates your cardiovascular risk into a number everyone understands: years. If your heart age is higher than your actual age, your estimated risk is above average. Here is how the number is calculated, what it means, and which factors influence it.
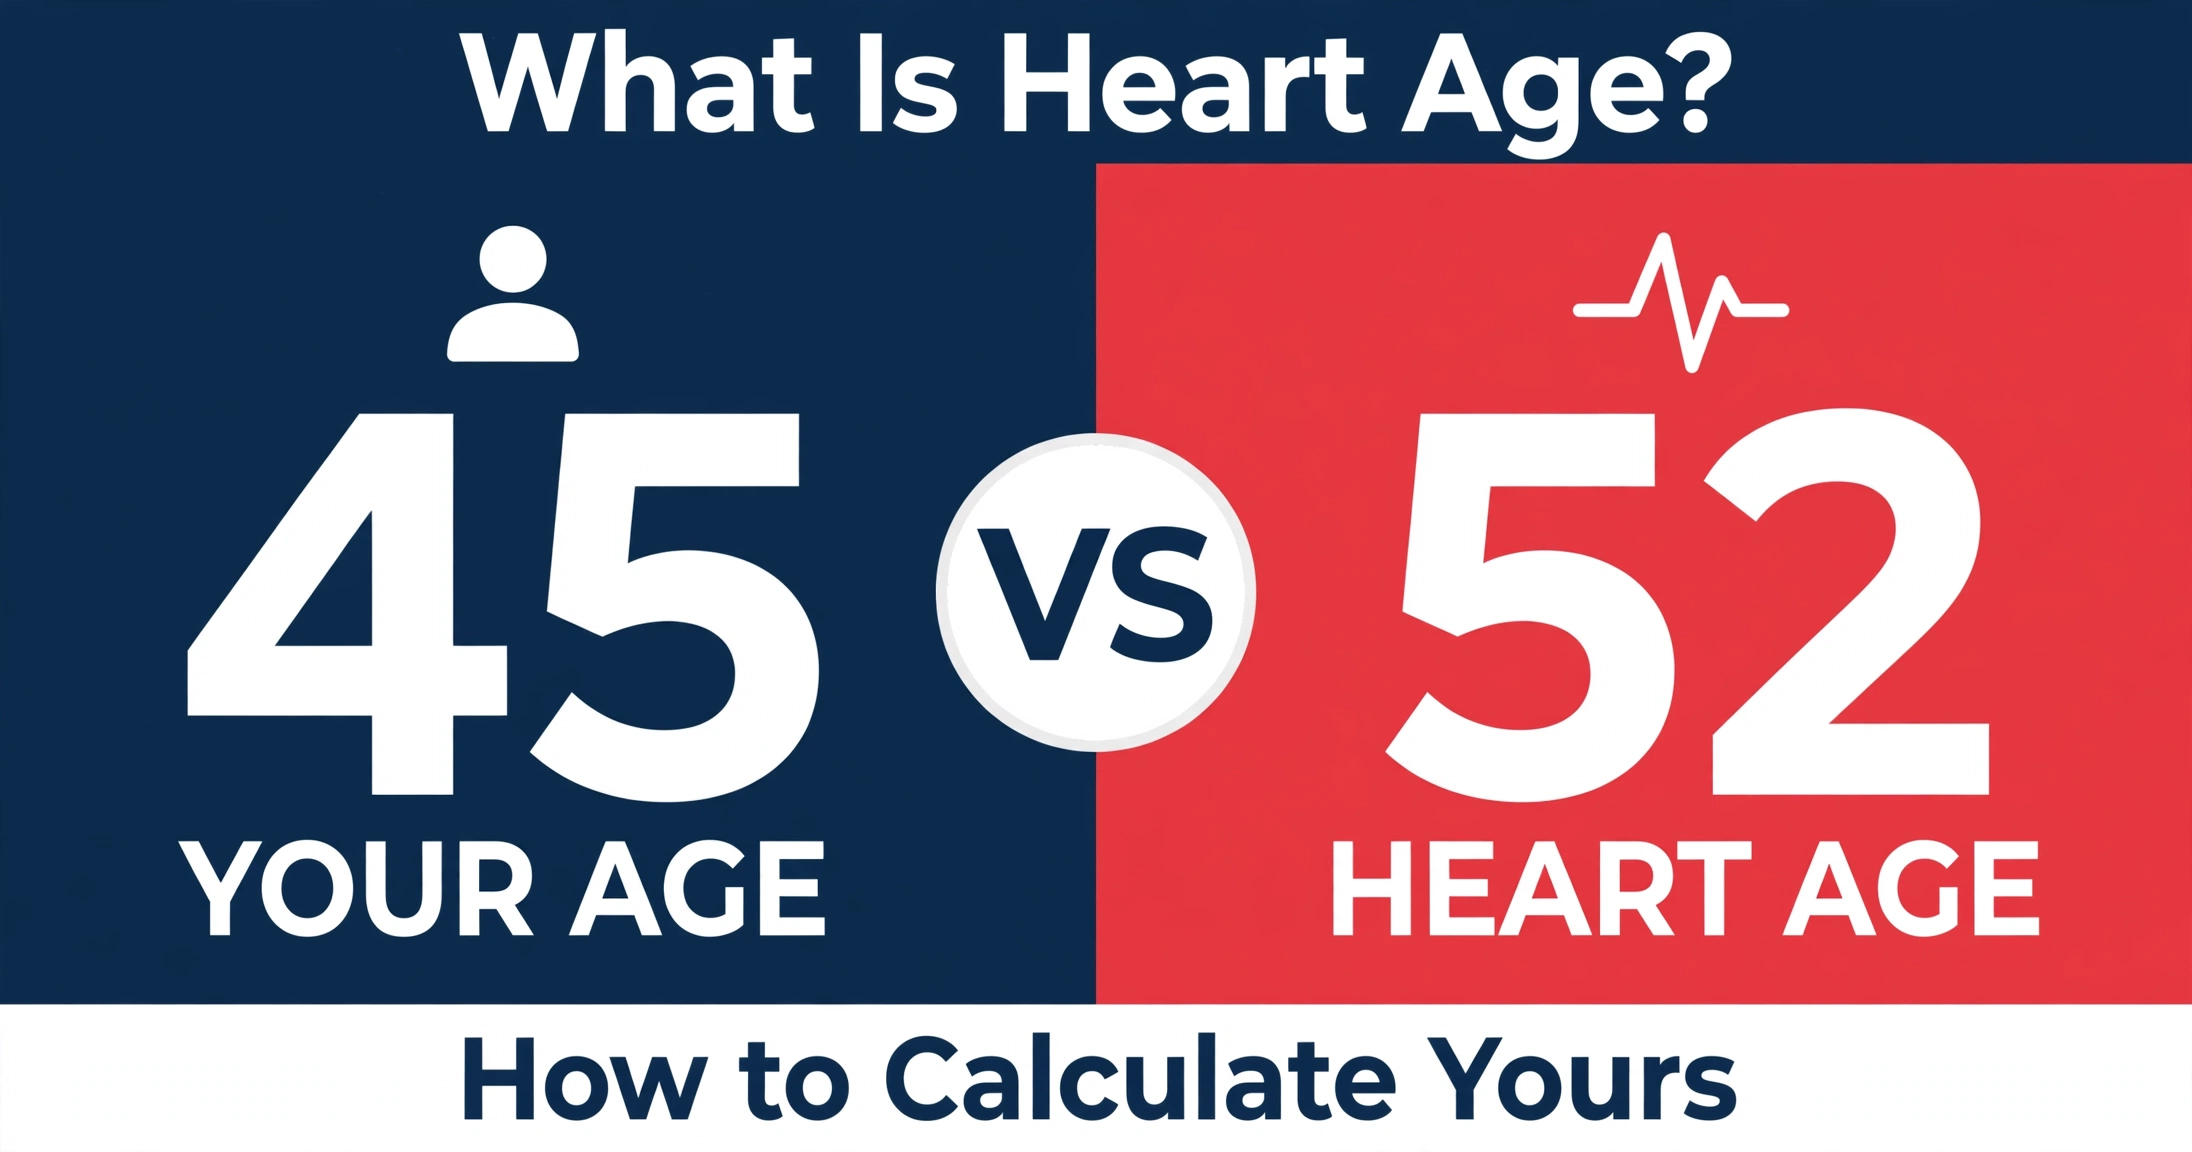
Heart age translates estimated cardiovascular risk into an age-equivalent number that is easy to compare against your actual age.
Key Takeaways
- Heart age is the age at which a person with optimal risk factors would carry your same estimated 10-year cardiovascular risk.
- The classic calculation uses the Framingham point system (D'Agostino et al., 2008): points for age, cholesterol, HDL, blood pressure, smoking, and diabetes map to a 10-year risk, then to a "vascular age."1
- A heart age older than your actual age corresponds to higher estimated risk; a younger heart age corresponds to lower estimated risk.
- The newer AHA PREVENT equations (Khan et al., 2024) use the same heart-age logic with a larger, more diverse derivation population and additional variables such as kidney function.2
- Heart age is a population-based risk estimate, not a measure of existing heart disease or a substitute for clinical evaluation.
Heart age is the chronological age of a person with optimal risk factors whose estimated 10-year cardiovascular risk matches yours. If your heart age is higher than your actual age, your estimated cardiovascular risk is above average for your age group.
Clinicians and researchers use heart age as a communication tool. Percentages can feel abstract — most people struggle to interpret what a "12% 10-year risk" means for them. An age-equivalent number is intuitive: a 50-year-old told their heart age is 60 understands the message immediately. The number comes from the same risk models behind standard heart scores, presented in a different format.
What Is Heart Age?
Heart age (also called vascular age in the research literature) is the chronological age of a person with the same estimated cardiovascular risk as you, but with optimal risk factors. The "optimal" reference profile used in the Framingham-based calculation is a non-smoker without diabetes, with total cholesterol below 160 mg/dL, HDL cholesterol of 60 mg/dL or higher, and untreated systolic blood pressure below 120 mmHg.1
The concept starts with a standard risk calculation. A model estimates your 10-year probability of a cardiovascular event from your risk factor values. Then, instead of reporting the percentage alone, the model asks: at what age would someone with ideal risk factors carry that same percentage risk? That age is your heart age. If your risk factors are unfavorable, the matching optimal-profile age is older than you. If your risk factors are favorable, the matching age can be younger than you.
The idea traces back to the Framingham Heart Study, the long-running cohort study that has followed residents of Framingham, Massachusetts since 1948.3 In 2008, D'Agostino and colleagues published a general cardiovascular risk profile for use in primary care, and their point-based system included a "vascular age" column alongside the traditional 10-year risk percentage.1 That publication is the foundation for most heart-age calculators in use today, including the heart age calculator on this site.
It helps to keep two ideas separate. Heart age describes estimated risk, not the physical condition of your heart or arteries. A heart age of 60 does not mean your arteries are 60 years old, and it does not mean disease is present. It means your estimated 10-year risk of a cardiovascular event matches the risk of a typical 60-year-old with optimal risk factors. Risk and anatomy are related but distinct: risk models estimate probability from population patterns, while imaging tests (such as coronary artery calcium scoring) look at actual plaque.
Heart age is also distinct from biological age tests that measure cellular markers. Those tests estimate how quickly cells appear to be aging. Heart age uses only standard cardiovascular risk factors — the same inputs clinicians enter into established risk calculators. It is a reframing of existing, validated risk mathematics rather than a new biological measurement.
How Heart Age Is Calculated: The Framingham Method
The Framingham method calculates heart age in four steps. First, each risk factor is converted into points using the sex-specific tables published by D'Agostino et al. in 2008.1 Second, the points are added into a single total. Third, the total maps to a 10-year cardiovascular risk percentage. Fourth, the same total maps to a vascular (heart) age — the age at which someone with optimal risk factors would have that same risk.
The tables below show the point assignments for men from the published Framingham general cardiovascular risk model. Women use a separate table with different point values. Points for total cholesterol, smoking, and diabetes vary by age band, which reflects that the relative effect of these factors changes with age.
Point Assignments by Risk Factor (Men)
| Risk Factor | Categories and Points |
|---|---|
| Age (years) | 30–34: −1 · 35–39: 0 · 40–44: 1 · 45–49: 2 · 50–54: 3 · 55–59: 4 · 60–64: 5 · 65–69: 6 · 70–74: 7 |
| HDL cholesterol (mg/dL) | ≥60: −2 · 50–59: −1 · 45–49: 0 · 35–44: 1 · <35: 2 |
| Systolic BP, untreated (mmHg) | <120: −2 · 120–129: 0 · 130–139: 1 · 140–159: 2 · ≥160: 3 |
| Systolic BP, treated (mmHg) | <120: 0 · 120–129: 2 · 130–139: 3 · 140–159: 4 · ≥160: 5 |
| Factor (points vary by age band) | 30–39 | 40–49 | 50–59 | 60–69 | 70–74 |
|---|---|---|---|---|---|
| Total cholesterol <160 / 160–199 / 200–239 / 240–279 / ≥280 mg/dL | 0 / 1 / 2 / 3 / 4 | 0 / 1 / 2 / 3 / 3 | 0 / 1 / 1 / 2 / 2 | 0 / 0 / 1 / 1 / 2 | 0 / 0 / 1 / 1 / 1 |
| Current smoker | 4 | 3 | 2 | 1 | 1 |
| Diabetes | 3 | 2 | 1 | 1 | 1 |
Once the points are totaled, the published model maps each total to a 10-year risk percentage and a vascular age. The mapping below is for men; women's mapping uses the same structure with different numbers.1
Total Points → 10-Year Risk → Vascular (Heart) Age (Men)
| Points | 10-Year CVD Risk | Vascular Age |
|---|---|---|
| −1 or less | 1.6% | <30 |
| 0 | 1.9% | 30 |
| 1 | 2.4% | 32 |
| 2 | 2.8% | 34 |
| 3 | 3.3% | 36 |
| 4 | 3.9% | 38 |
| 5 | 4.7% | 40 |
| 6 | 5.6% | 42 |
| 7 | 6.7% | 45 |
| 8 | 7.9% | 48 |
| 9 | 9.4% | 51 |
| 10 | 11.2% | 54 |
| 11 | 13.3% | 57 |
| 12 | 15.6% | 60 |
| 13 | 18.4% | 64 |
| 14 | 21.6% | 68 |
| 15 | 25.3% | 72 |
| 16 | 29.4% | 76 |
| 17 | 33.8% | 80 |
| 18 or more | >40% | >80 |
A worked example makes the process concrete. Consider a 50-year-old man with total cholesterol of 280 mg/dL, HDL of 40 mg/dL, untreated systolic blood pressure of 160 mmHg, who smokes and does not have diabetes. His points: age 3, cholesterol (50–59 band) 2, HDL 1, systolic BP untreated 3, smoker 2, diabetes 0 — a total of 11 points. Eleven points corresponds to a 10-year cardiovascular risk of 13.3% and a vascular age of 57. His heart age is 57, seven years older than his actual age of 50.
The Framingham Risk Score calculator on this site uses the same 2008 D'Agostino et al. general cardiovascular risk model, covering coronary heart disease, stroke, peripheral artery disease, and heart failure as a composite outcome.1 The model's derivation cohort came from the Framingham Original and Offspring studies, with validation showing good discrimination and calibration in the source population.
The PREVENT-Based Method
In 2023, the American Heart Association released the PREVENT™ (Predicting Risk of cardiovascular disease EVENTs) equations, with the full development and validation paper published in 2024 by Khan and colleagues.2 PREVENT represents the newest generation of cardiovascular risk prediction and offers a second, more current way to arrive at a heart-age number.
PREVENT was developed from more than 6 million adults across 25 datasets, a much larger and more contemporary population than the Framingham derivation cohort.2 It estimates both 10-year and 30-year risk of total cardiovascular disease — including atherosclerotic events and heart failure — rather than 10-year risk alone. Unlike the older Pooled Cohort Equations, PREVENT is race-free: it does not use race as an input variable. It also incorporates variables the older models omit: estimated glomerular filtration rate (eGFR) as a marker of kidney function, plus optional inputs for urine albumin-to-creatinine ratio, HbA1c, and a social deprivation index based on ZIP code.2
The heart-age logic works the same way under PREVENT. The model estimates 10-year total cardiovascular risk from a person's actual values, then finds the age at which a person with optimal risk factors would carry that identical risk. That age is the heart age. Because PREVENT includes heart failure in its outcome and accounts for kidney function, the resulting heart-age numbers can differ from Framingham-based ones for the same person. The two methods share the same inputs at their core (age, sex, blood pressure, cholesterol, smoking, diabetes) but weight them differently and draw on different population data.
Several practical differences separate the methods. Framingham uses a transparent point sheet that anyone can follow by hand. PREVENT uses model equations computed by software, which allows more variables and interactions but cannot be reduced to a simple point table. Framingham's outcome is general cardiovascular disease over 10 years. PREVENT adds a 30-year horizon and separates atherosclerotic events from heart failure, which gives clinicians a longer view for younger adults — a group for whom 10-year risk is often low even when lifetime risk is substantial.5
Our comparison of the two risk engines goes into more depth in ASCVD vs PREVENT: Key Differences Explained. The key point for heart age is that both frameworks translate risk into years; they simply start from different risk estimates.
❤️ Check Your Heart Age
Enter your age, blood pressure, cholesterol, and other risk factors to see your estimated heart age.
Check Your Heart Age →What It Means If Your Heart Age Is Older Than You
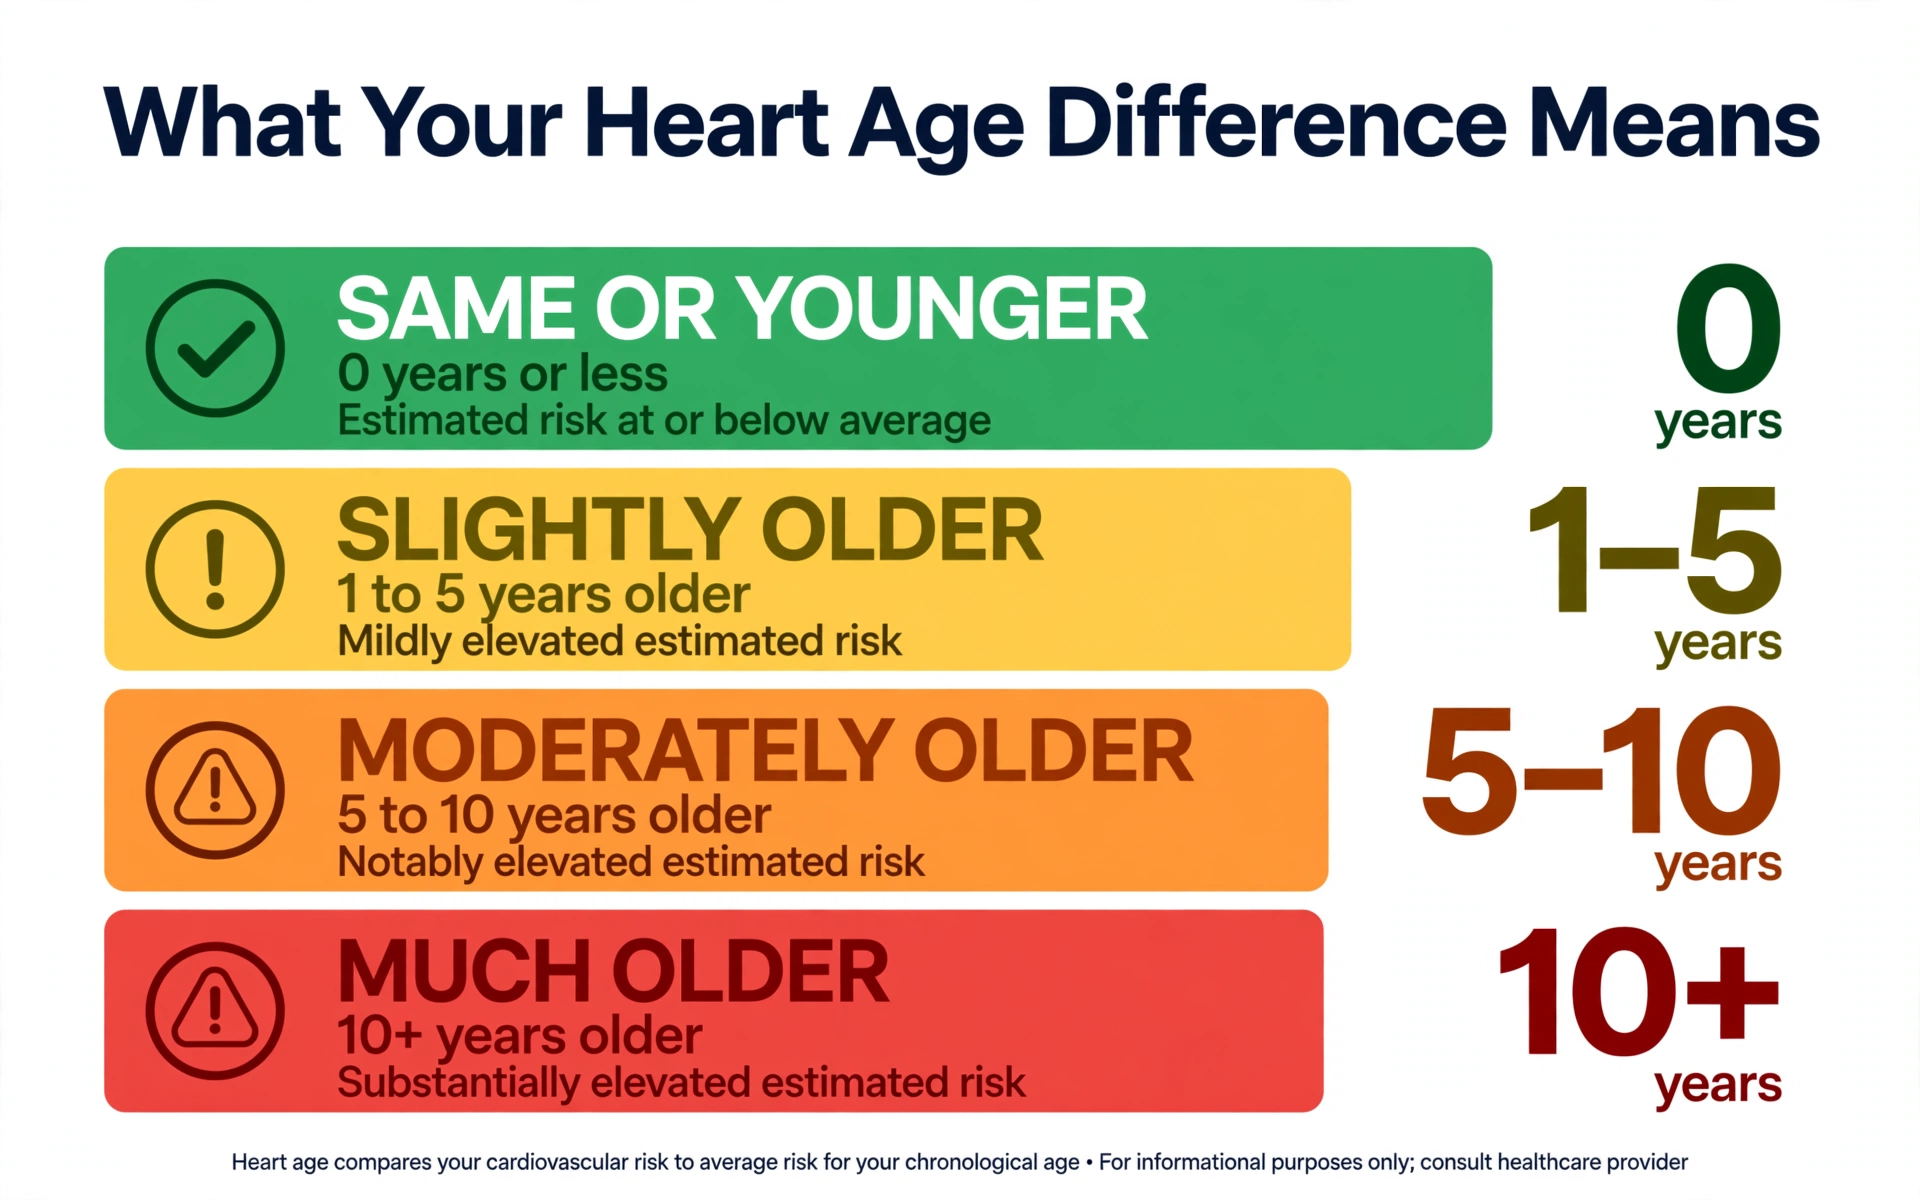
A heart age above your actual age corresponds to higher estimated cardiovascular risk than average for your age group. The size of the gap carries the meaning: a one- or two-year difference reflects a modest elevation in estimated risk, while a gap of five or more years reflects a substantially higher estimated risk. The table below frames the interpretation objectively — heart age describes probability estimates from population models, not a forecast of what will happen to any one person.
| Heart Age vs Actual Age | Interpretation | What It Reflects |
|---|---|---|
| Heart age younger than actual age | Below-average estimated risk | Favorable risk factor profile; estimated risk below the age-group average |
| Heart age equals actual age | Average estimated risk | Estimated risk matches a same-age person with optimal risk factors |
| 1–5 years older | Above-average estimated risk | One or more risk factors raise the estimate above the optimal baseline |
| 5+ years older | Well above-average estimated risk | Multiple or strongly elevated risk factors drive a higher risk estimate |
Consider what drives a large gap. Using the Framingham men's table, a 50-year-old at 11 points has a heart age of 57 — seven years older than his actual age, with a 13.3% 10-year risk. If his systolic blood pressure were 120 mmHg untreated (0 points instead of 3) and he did not smoke (0 instead of 2), his total would fall to 6 points: a 5.6% risk and a heart age of 42 — eight years younger than his actual age. The same person, different risk factor values, very different heart age. The gap is entirely a function of the inputs.
This is why clinicians view heart age as a communication aid rather than a separate medical finding. The gap between heart age and actual age summarizes, in one number, how far a person's risk factor profile sits from optimal. A larger gap corresponds to higher estimated risk, which is the same information the underlying percentage conveys. The age format exists because many people find "your heart age is 60" easier to grasp than "your 10-year risk is 15.6%."
It is worth noting that the gap can also reflect factors a person cannot change. Age itself is the strongest driver of most risk models: each additional year of chronological age adds points in the Framingham system.1 Sex also affects the baseline. So an older adult may have a heart age close to their actual age even with some elevated risk factors, while a younger adult with one strongly elevated factor can show a larger gap. The number should always be read in the context of the individual inputs, not in isolation.
Finally, heart age does not indicate whether disease is already present. Two people can share the same heart age while having very different coronary arteries — one with no plaque, one with established atherosclerosis. Risk estimation and disease detection are different tasks, and heart age performs only the first.
7 Ways to Lower Your Heart Age
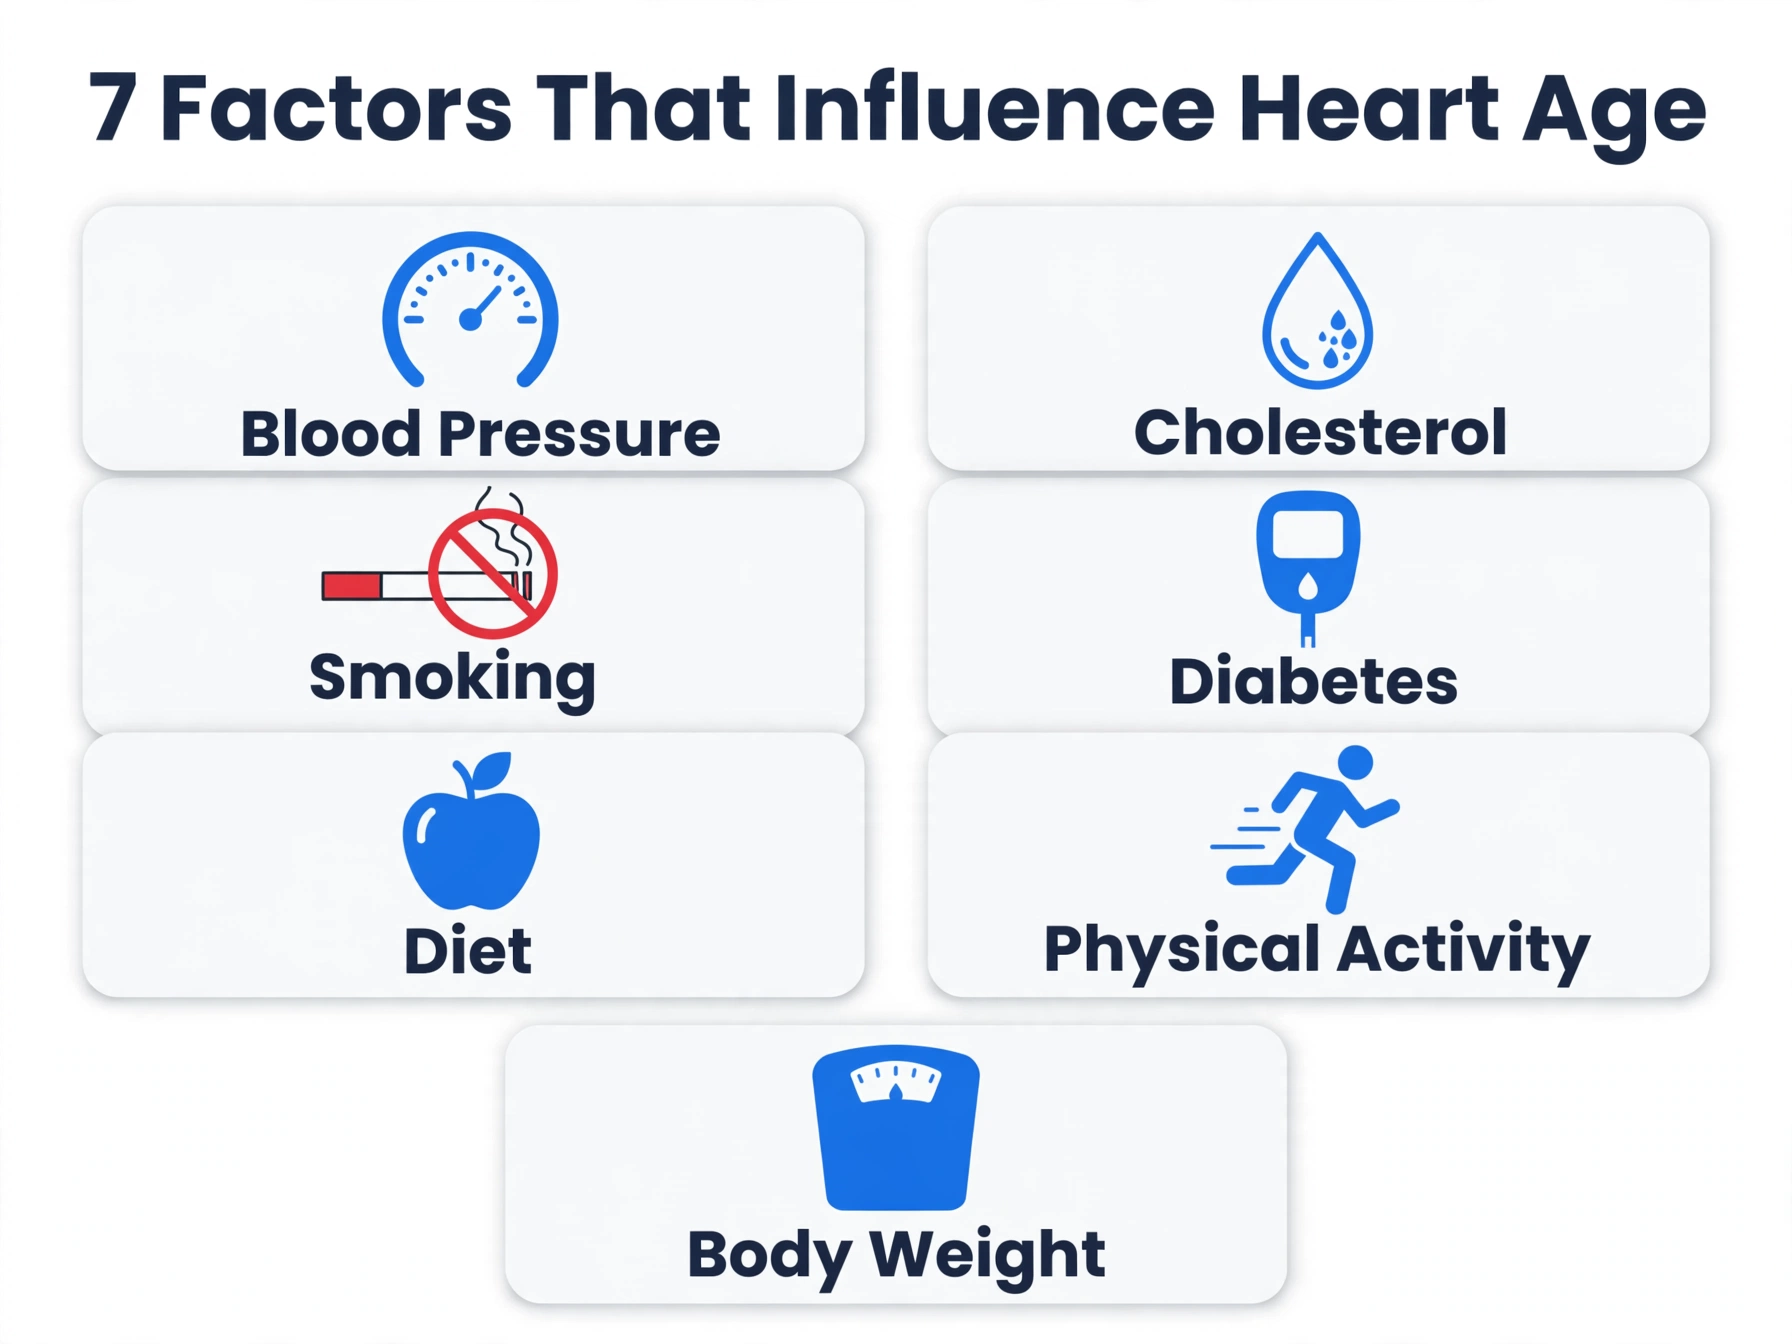
Heart age is derived directly from risk factor values, so any change in those values changes the result. The seven factors below are the inputs most heart-age calculators use, stated objectively — the documented association between each factor and estimated risk.
1. Blood Pressure
Higher systolic blood pressure is associated with higher estimated cardiovascular risk — and lower systolic pressure with lower estimated risk — in both the Framingham and PREVENT models.1,2 The 2017 ACC/AHA guideline defines normal as below 120/80 mmHg and hypertension as 130/80 mmHg or higher.6
2. LDL Cholesterol
Lower LDL cholesterol is associated with lower estimated cardiovascular risk, and the 2018 cholesterol guideline identifies LDL as a primary lipid target for risk reduction.7 In the Framingham point system, lower total cholesterol directly reduces the point total for most age bands.1 The LDL calculator on this site estimates LDL from a standard lipid panel.
3. Smoking Status
Current smoking adds more points than any single factor in the Framingham men's table — up to 4 points for smokers aged 30–39.1 Former smokers are classified as non-smokers in these models. Smoking is a major modifiable cardiovascular risk factor.8,9
4. Diabetes Control
Diabetes contributes points in every age band of the Framingham system.1 PREVENT adds HbA1c as an optional input, allowing the model to distinguish levels of glycemic control rather than treating diabetes as a simple yes-or-no input.2
5. Healthy Diet
Dietary patterns affect several model inputs at once: blood pressure, cholesterol, body weight, and diabetes risk. The 2019 ACC/AHA primary prevention guideline describes diets emphasizing vegetables, fruits, whole grains, and lean proteins as associated with lower cardiovascular risk.9
6. Physical Activity
Regular physical activity is associated with lower blood pressure, healthier lipids, better weight control, and improved insulin sensitivity — all inputs or near-inputs to heart-age models.9 The primary prevention guideline cites 150 minutes per week of moderate-intensity activity as the commonly referenced benchmark.9
7. Weight
Higher body weight is associated with higher blood pressure, less favorable lipids, and greater diabetes risk — the pathways through which weight influences heart-age estimates.9 The AHA's 2023 advisory describes excess adiposity as a central driver across cardiovascular-kidney-metabolic risk domains.10
A pattern runs through all seven: heart age responds to measured risk factors, not to effort or intention. When the underlying values change, the number moves — making it a useful trackable metric over time.
Heart Age vs ASCVD Risk Score
Heart age and the ASCVD risk score often come from the same underlying data but present it in different formats. The ASCVD Pooled Cohort Equations estimate a 10-year percentage risk of atherosclerotic cardiovascular disease (heart attack, stroke, or cardiovascular death) in adults aged 40–75 without known disease.4 A heart-age calculator takes that same risk estimate and converts it into an age-equivalent number. The inputs overlap heavily: age, sex, blood pressure, cholesterol, smoking, and diabetes.
The practical difference is presentation, not mathematics. A percentage supports clinical thresholds: the 2018 cholesterol guideline uses ASCVD cut points — below 5% low risk, 5% to under 7.5% borderline, 7.5% to under 20% intermediate, 20% or higher high risk — to structure discussions about preventive therapy.7 Our guide to what counts as a good heart score explains these ranges in detail. An age-equivalent number supports communication: many people grasp "your heart age is 62" more readily than "your 10-year risk is 18.4%."
Each format suits different moments. Clinicians discussing treatment thresholds tend to use the percentage, because guidelines are written around percentages. Patient education materials and public health campaigns tend to use heart age, because the format motivates engagement without requiring statistical literacy. Neither format is more "correct" — they are two views of the same risk estimate.
One nuance: the two formats can diverge when different models are involved. An ASCVD percentage from the Pooled Cohort Equations and a heart age from the Framingham point system may not align perfectly, because the models were derived from different populations and predict slightly different outcomes (atherosclerotic events only versus general cardiovascular disease including heart failure).1,4 This is normal variation between models, not an error in either one.
Limitations of Heart Age
Heart age has real limits, and understanding them matters more than the number itself. First, heart age is a population-based estimate, not an individual prediction. A heart age of 60 with an underlying 15.6% 10-year risk means that among 100 people with that risk profile, roughly 16 would be expected to experience a cardiovascular event in 10 years. The model cannot say which 16, and any single person's outcome can differ from the group average.
Second, the models behind heart age omit several established risk factors. The Framingham point system does not include family history of premature cardiovascular disease, lipoprotein(a) levels, coronary artery calcium, inflammatory markers, or detailed dietary and activity patterns.1 A person with a strong family history or elevated Lp(a) may carry higher actual risk than the calculated heart age suggests. Clinicians evaluate these risk-enhancing factors alongside any score.7
Third, the models are calibrated to specific populations. The Framingham equations were derived primarily from a White population in Massachusetts, and their accuracy varies across other racial and ethnic groups and outside the 30–74 age range.1,3 PREVENT expanded the derivation population to more than 6 million adults and removed race as an input, which improved generalizability — but no model captures every subgroup equally well.2
Fourth, heart age assumes risk factors stay fixed over the prediction period, which they rarely do. Blood pressure, cholesterol, smoking status, and diabetes status all change. A heart age calculated today reflects today's values; recalculation is needed when those values move. Clinical guidelines suggest reassessing cardiovascular risk every 4 to 6 years in the primary prevention population, or sooner when values change.4
Fifth, heart age does not detect existing disease. It estimates the probability of future events. Subclinical atherosclerosis — plaque that has not caused symptoms — is invisible to risk-factor models. Imaging such as coronary artery calcium scoring can reveal plaque that heart age alone would miss, which is why guidelines suggest considering CAC in intermediate-risk cases where decisions are uncertain.7
Finally, heart age is not a medical diagnosis and does not replace clinical evaluation. It is a communication tool built on validated risk mathematics. Its value lies in making estimated risk understandable and trackable, not in settling questions about any individual's health. The ASCVD risk calculator on the homepage and the related tools below use the same evidence base for those who want the underlying numbers.
❤️ Know Your Numbers
Calculate your heart age, then check your 10-year ASCVD risk percentage — two views of the same estimate.
Check Your Heart Age → Try the ASCVD Calculator →
Frequently Asked Questions
What is a good heart age?
How is heart age different from chronological age?
Can my heart age be younger than my actual age?
Why is my heart age higher than my actual age?
Is heart age a measure of existing heart disease?
Sources
- D'Agostino RB Sr, Vasan RS, Pencina MJ, et al. General cardiovascular risk profile for use in primary care: the Framingham Heart Study. Circulation. 2008;117(6):743-753. DOI: 10.1161/CIRCULATIONAHA.107.699579
- Khan SS, Coresh J, Pencina MJ, et al. Development and Validation of the American Heart Association's PREVENT Equations. Circulation. 2024;149(6):430-449. DOI: 10.1161/CIRCULATIONAHA.123.067626
- National Heart, Lung, and Blood Institute. Framingham Heart Study (FHS). nhlbi.nih.gov/science/framingham-heart-study-fhs
- Goff DC Jr, Lloyd-Jones DM, Bennett G, et al. 2013 ACC/AHA Guideline on the Assessment of Cardiovascular Risk. Circulation. 2014;129(25 Suppl 2):S49-S73. DOI: 10.1161/01.cir.0000437741.48606.98
- Lloyd-Jones DM, Leip EP, Larson MG, et al. Prediction of lifetime risk for cardiovascular disease by risk factor burden at 50 years of age. Circulation. 2006;113(6):791-798. DOI: 10.1161/CIRCULATIONAHA.105.548206
- Whelton PK, Carey RM, Aronow WS, et al. 2017 ACC/AHA/AAPA/ABC/ACPM/AGS/APhA/ASH/ASPC/NMA/PCNA Guideline for the Prevention, Detection, Evaluation, and Management of High Blood Pressure in Adults. Hypertension. 2018;71(6):e13-e115. DOI: 10.1161/HYP.0000000000000065
- Grundy SM, Stone NJ, Bailey AL, et al. 2018 AHA/ACC/AACVPR/AAPA/ABC/ACPM/ADA/AGS/APhA/ASPC/NLA/PCNA Guideline on the Management of Blood Cholesterol. Circulation. 2019;139(25):e1082-e1143. DOI: 10.1161/CIR.0000000000000625
- Pencina MJ, Navar AM, Wojdyla D, et al. Quantifying importance of major risk factors for coronary heart disease. Circulation. 2019;139(13):1603-1611. DOI: 10.1161/CIRCULATIONAHA.117.031855
- Arnett DK, Blumenthal RS, Albert MA, et al. 2019 ACC/AHA Guideline on the Primary Prevention of Cardiovascular Disease. Circulation. 2019;140(11):e596-e646. DOI: 10.1161/CIR.0000000000000678
- Ndumele CE, Rangaswami J, Chow SL, et al. Cardiovascular-Kidney-Metabolic Health: A Presidential Advisory From the American Heart Association. Circulation. 2023;148(20):1606-1635. DOI: 10.1161/CIR.0000000000001184
- Wilson PWF, D'Agostino RB, Levy D, et al. Prediction of coronary heart disease using risk factor categories. Circulation. 1998;97(18):1837-1847. DOI: 10.1161/01.CIR.97.18.1837
Editorial review: This article was reviewed by the Heart Score Calculator Editorial Team on October 18, 2026. The professional name "Dr. Heart" identifies this editorial work and does not replace advice, diagnosis or treatment from a licensed healthcare professional.