eGFR by Age: What's Normal and When to Worry
eGFR normally falls with age — from about 116 mL/min/1.73m² in the 20s to about 67 in the 80s. A sustained reading below 60, albumin in the urine, or a fast decline signals concern at any age. Lower eGFR also tracks with higher heart risk.
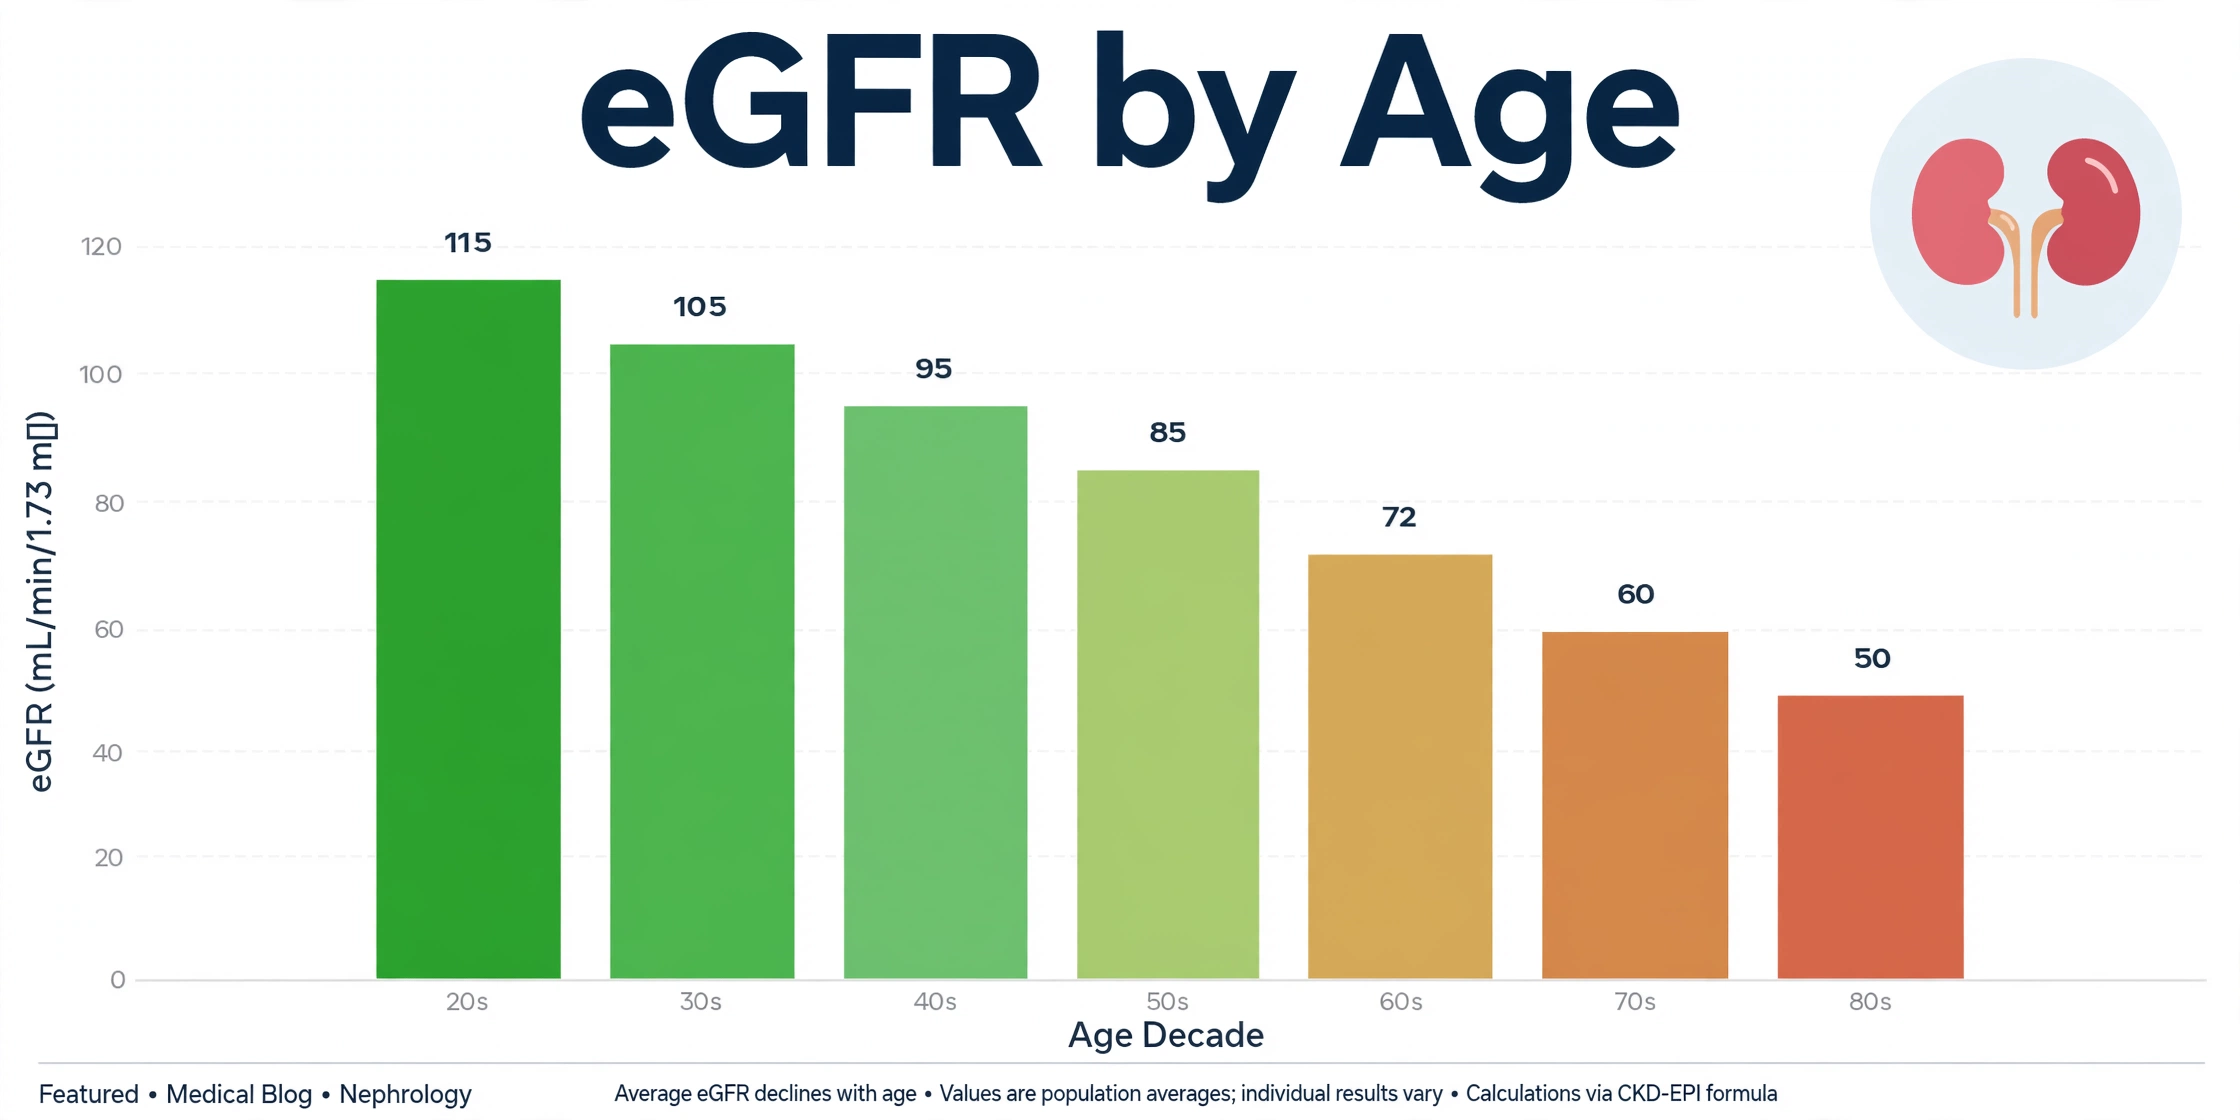
Normal eGFR declines gradually with age. Population averages fall from about 116 mL/min/1.73m² in the 20s to about 67 in the 80s.
Key Takeaways
- eGFR estimates how well the kidneys filter blood, in mL/min/1.73m². Young adults typically land between 90 and 120.
- The CKD-EPI 2021 equation is the current race-free standard, using serum creatinine, age, and sex.
- eGFR falls roughly 0.5–1 unit per year after age 40. Decade averages drop from ~116 (20s) to ~67 (80s).
- An eGFR below 60 for over three months, albumin in the urine, or a fast decline signals concern at any age.
- Lower eGFR is tied to higher cardiovascular risk — newer heart-risk tools such as PREVENT include it.
A normal eGFR sits between 90 and 120 mL/min/1.73m² in young adults and drifts lower with age, so a result that looks low for a 30-year-old can be typical for an 80-year-old. Concern starts when eGFR stays below 60 for more than three months, when albumin appears in the urine, or when the number falls faster than the expected age-related decline.
Kidney function also matters for the heart. Large population studies link falling eGFR with rising cardiovascular risk, and newer risk models such as PREVENT include eGFR as an input. This article explains what eGFR measures, how age shapes it, and where clinicians draw the line between normal aging and a warning sign.
What Is eGFR?
eGFR stands for estimated glomerular filtration rate. It estimates how many milliliters of blood plasma the kidneys filter each minute, standardized to a body surface area of 1.73m². The number serves as the main laboratory measure of kidney function in clinical practice.
Each kidney contains about one million nephrons, and each nephron has a glomerulus — a tuft of tiny blood vessels where filtration begins. Together, healthy glomeruli filter roughly 180 liters of fluid per day. eGFR expresses that filtering capacity as a single number clinicians can track over time.
The estimate starts with serum creatinine, a waste product from normal muscle breakdown. Creatinine passes freely through the glomeruli, so when filtering capacity falls, creatinine builds up in the blood. A higher creatinine level generally points to a lower eGFR. The equation adjusts the creatinine value for age and sex because muscle mass — and therefore creatinine production — varies across people.
Measured GFR, the true gold standard, uses an infused marker such as inulin that is filtered but neither secreted nor reabsorbed. That method requires timed infusions and urine collections, so it stays in research settings. eGFR trades a small amount of precision for practicality: one routine blood draw yields the estimate.1
Creatinine has known confounders. Very muscular or very small people, vegetarians on low-protein diets, and anyone taking certain medications (such as trimethoprim or cimetidine) can get misleading estimates. For that reason, clinicians treat eGFR as an estimate with context, not a direct measurement. Cystatin C — an alternative filtration marker unaffected by muscle mass — serves as the confirmatory test when creatinine looks unreliable.2
How eGFR Is Calculated (CKD-EPI 2021)
Most laboratories now use the CKD-EPI 2021 creatinine equation. It estimates GFR from serum creatinine, age, and sex, with no race variable. The equation replaced the 2009 version, which included a race coefficient that overestimated kidney function in Black patients and contributed to health inequities.2
The 2009 CKD-EPI equation came from a collaboration of research cohorts led by Levey and colleagues, and it became the global standard for creatinine-based estimation.1 In 2021, a National Kidney Foundation–American Society of Nephrology task force recommended removing race from kidney function equations. Inker and colleagues published refit equations without the race term in the New England Journal of Medicine the same year.2
The KDIGO 2024 clinical practice guideline endorses the CKD-EPI 2021 creatinine equation as the preferred first-line method for estimating GFR in adults.3 Laboratories in most health systems have switched, so results printed today usually reflect the race-free formula. A change in eGFR around the switch date may reflect the new equation rather than a change in kidney function.
κ = 0.7 (female), 0.9 (male) · α = −0.241 (female), −0.302 (male)
Result in mL/min/1.73m² · Scr = serum creatinine in mg/dL
The formula has two parts. Below a creatinine threshold (κ), eGFR rises gently as creatinine falls; above it, eGFR drops steeply as creatinine climbs. The age term (0.9938^Age) builds the expected age-related decline directly into the estimate — the reason two people with the same creatinine get different eGFRs at age 30 and age 70.
Cystatin C versions of the equation exist for confirmation. The CKD-EPI 2021 cystatin C equation and the combined creatinine–cystatin C equation improve accuracy when creatinine is unreliable, such as in very muscular or frail patients.2 The GFR calculator on this site applies the race-free 2021 CKD-EPI creatinine equation, matching current laboratory practice.
Normal eGFR by Age
Normal eGFR is not a single number. It averages about 116 mL/min/1.73m² in the 20s and falls to about 67 in the 80s. The table below shows approximate population averages by decade, drawn from large population surveys such as NHANES.4
| Age Decade | Approximate Mean eGFR | What It Reflects |
|---|---|---|
| 20s | ~116 | Peak kidney function in young adults |
| 30s | ~107 | Near-peak function; early gradual change |
| 40s | ~99 | Gradual age-related decline begins |
| 50s | ~93 | Continued steady decline |
| 60s | ~85 | Mildly decreased but often typical for the decade |
| 70s | ~75 | Moderately below young-adult levels; frequently normal aging |
| 80s | ~67 | Below 60 can occur without other disease markers |
Units: mL/min/1.73m². Values are approximate population averages, not diagnostic cutoffs for any individual.
These averages describe population patterns. Individuals vary widely: a healthy 75-year-old can have an eGFR of 95, and a 55-year-old can sit at 70. Genetics, blood pressure history, diabetes, and body size all shift a person's position around the average.
The table also explains a common source of confusion. Many laboratory reports flag any eGFR below 90 as "low." A 68-year-old with an eGFR of 82 may see that flag and worry, even though 82 sits near the average for the 60s. The flag uses a fixed threshold; age context changes the reading.
Some nephrologists argue the fixed thresholds go too far in the other direction. Delanaye and colleagues proposed age-adapted cutoffs, noting that labeling every 78-year-old with an eGFR of 55 as having chronic kidney disease may overstate risk, since such patients rarely progress to kidney failure without albuminuria.7 KDIGO 2024 keeps the standard G-stage cutoffs but emphasizes interpreting them alongside albuminuria and the person's full clinical picture.3
🧮 Estimate Your eGFR
Calculate eGFR from serum creatinine, age, and sex using the race-free CKD-EPI 2021 equation.
Try the GFR Calculator → Try the Creatinine Clearance Calculator →How Fast eGFR Declines with Age
After roughly age 40, eGFR declines by about 0.5 to 1 mL/min/1.73m² per year, with a faster loss after age 65. Over a decade, that adds up to roughly 5 to 10 units — the gap between the decade averages in the table above.
Early physiology studies measured the decline at about 0.96 mL/min per year from age 30 onward.5 Studies of healthy living kidney donors — people screened to be free of kidney disease — confirm a steady downward slope, though the exact rate differs across cohorts.5
The decline comes from structural change. Kidneys lose nephrons and cortical mass with age, glomeruli scar, and blood flow to the kidneys falls. By the eighth decade, sclerotic glomeruli can make up a substantial share of the filtering units, even in people without kidney disease.5
Averages hide wide variation. Longitudinal studies show that many older adults lose almost no kidney function over years of follow-up, while others decline several units per year. Hypertension and diabetes accelerate the loss beyond the baseline aging rate, which is why blood pressure and glucose control appear in every kidney guideline.3
For that reason, clinicians weigh the slope as much as the number. An eGFR that drifts from 88 to 84 over five years follows the expected aging curve. The same drop over six months, or a loss of more than about 5 units per year, raises questions and usually triggers repeat testing and a search for reversible causes.
When Declining eGFR Signals Concern
Declining eGFR signals concern when it stays below 60 mL/min/1.73m² for more than three months, when albumin appears in the urine, or when it drops faster than the expected age-related rate. A single low reading on its own does not meet that standard.3
KDIGO defines chronic kidney disease as abnormalities of kidney structure or function present for more than three months with health implications. In practice, that means an eGFR below 60 on repeat testing, or markers of kidney damage (such as albuminuria) at any eGFR.3 The G-stages below organize eGFR into clinical bands:
| Stage | eGFR Range | Description |
|---|---|---|
| G1 | ≥ 90 | Normal or high — CKD only if other damage markers are present |
| G2 | 60–89 | Mildly decreased — often age-typical in older adults |
| G3a | 45–59 | Mildly to moderately decreased |
| G3b | 30–44 | Moderately to severely decreased |
| G4 | 15–29 | Severely decreased |
| G5 | < 15 | Kidney failure |
Units: mL/min/1.73m². Staging follows the KDIGO 2024 guideline and requires persistence beyond three months.3
Albumin in the urine adds a second axis to the picture. Clinicians measure it with the urine albumin-to-creatinine ratio (UACR): below 30 mg/g is normal to mildly increased (A1), 30–300 mg/g is moderately increased (A2), and above 300 mg/g is severely increased (A3). KDIGO combines the G-stage with the albuminuria category into a risk heat map — a person at G3a with A3 albuminuria carries higher risk than someone at G3a with no albuminuria.3
A large collaborative meta-analysis showed why both axes matter: across general-population cohorts, lower eGFR and higher albuminuria each independently predicted all-cause and cardiovascular death, and the two together multiplied the risk.10
Several patterns draw attention regardless of the stage label. A confirmed drop of more than 5 units per year, new or rising albuminuria, blood or protein on urine testing, or eGFR loss alongside uncontrolled blood pressure all prompt closer evaluation. Clinicians also rule out acute causes before interpreting a low result — dehydration, recent illness, and medications such as NSAIDs can temporarily depress eGFR.3
eGFR and Heart Risk
Falling eGFR tracks with rising cardiovascular risk. In a landmark study of more than 1.1 million adults, the risk of cardiovascular events climbed at every eGFR step below 60 — and even modest reductions carried measurably higher risk.6
The numbers tell a graded story. Compared with people whose eGFR was 60 or higher, the adjusted hazard ratio for cardiovascular events was 1.4 at eGFR 45–59, 2.0 at 30–44, 2.8 at 15–29, and 3.4 below 15. Death risk followed the same staircase, reaching nearly sixfold at the lowest eGFR band.6 These associations held after adjusting for other risk factors, pointing to kidney function as an independent signal.
Several mechanisms connect the two organs. High blood pressure and diabetes damage kidney and artery walls together. As kidney function falls, inflammation rises, arteries calcify faster, anemia develops, and fluid balance shifts — each of which strains the heart. Albuminuria adds its own signal: it marks widespread vascular injury, not just kidney injury, which is why it predicts cardiovascular events even when eGFR looks fine.10
The link now shapes risk prediction itself. The AHA's PREVENT equations — the 2023 successor to the older pooled cohort equations — include eGFR as a predictor of cardiovascular risk, alongside optional albuminuria and HbA1c inputs.8 That change formalized what the data had shown for two decades: kidney markers belong in heart-risk assessment. Readers can see how eGFR feeds into heart risk with the PREVENT calculator.
Context helps when reading a heart score too. A person with an eGFR of 52 and a borderline heart score carries a different risk profile than someone with the same score and an eGFR of 95. Clinicians increasingly view kidney and heart risk as one picture rather than two separate charts — a shift reflected in how newer risk models compare with older ones.
🧮 See How eGFR Affects Heart Risk
The PREVENT equations include kidney function when estimating 10-year cardiovascular risk.
Try the PREVENT Calculator → Try the GFR Calculator →How Kidney Function Is Monitored
Kidney function is tracked with repeat eGFR measurements, urine albumin-to-creatinine ratio (UACR) tests, and blood pressure checks over time. The trend across readings matters more than any single value.3
Clinical pathways tie monitoring frequency to the KDIGO G and A categories. People with normal eGFR and no albuminuria are typically rechecked at routine intervals, while those in higher-risk bands — lower G-stage, higher albuminuria, or a fast decline — are tested more often. KDIGO 2024 lays out suggested frequencies for each combination of G-stage and albuminuria category.3
Repeat testing also filters out noise. A single eGFR can swing with hydration, a recent high-protein meal, intense exercise, or a short course of medication. Confirming a low result with a second test weeks later separates a real trend from a temporary dip. When creatinine itself looks unreliable — in very muscular, frail, or amputee patients — a cystatin C–based eGFR gives a second opinion.2
UACR testing completes the monitoring pair. Because albuminuria can appear while eGFR still looks normal, guidelines pair the two tests: eGFR measures filtering capacity, UACR detects early damage. Together they place a person on the KDIGO risk heat map and guide how closely clinicians follow up.3
Measured creatinine clearance offers another angle. It estimates clearance from a timed urine collection plus blood creatinine, rather than from an equation. The creatinine clearance calculator on this site estimates it with the Cockcroft–Gault formula, which clinicians still use for certain medication dosing decisions. Patients often discuss which test schedule fits their situation with their clinician during routine visits.
Frequently Asked Questions
What is a normal eGFR for my age?
At what eGFR level is there cause for concern?
Can eGFR go back up?
Why does eGFR decline with age?
How are kidney function and heart risk connected?
Sources
- Levey AS, Stevens LA, Schmid CH, et al. A new equation to estimate glomerular filtration rate. Ann Intern Med. 2009;150(9):604-612. DOI: 10.7326/0003-4819-150-9-200905050-00006
- Inker LA, Eneanya ND, Coresh J, et al. New creatinine- and cystatin C–based equations to estimate GFR without race. N Engl J Med. 2021;385:1737-1749. DOI: 10.1056/NEJMoa2102953
- Kidney Disease: Improving Global Outcomes (KDIGO) CKD Work Group. KDIGO 2024 Clinical Practice Guideline for the Evaluation and Management of Chronic Kidney Disease. Kidney Int. 2024;105(4S):S117–S314. DOI: 10.1016/j.kint.2024.01.002
- Coresh J, Selvin E, Stevens LA, et al. Prevalence of chronic kidney disease in the United States. JAMA. 2007;297(2):176-183. DOI: 10.1001/jama.297.2.176
- Denic A, Glassock RJ, Rule AD. Structural and functional changes with the aging kidney. Adv Chronic Kidney Dis. 2016;23(1):19-28. DOI: 10.1053/j.ackd.2015.08.007
- Go AS, Chertow GM, Fan D, McCulloch CE, Hsu CY. Chronic kidney disease and the risks of death, cardiovascular events, and hospitalization. N Engl J Med. 2004;351:1296-1305. DOI: 10.1056/NEJMoa041031
- Delanaye P, Jager KJ, Bökenkamp A, et al. CKD: a call for an age-adapted definition. J Am Soc Nephrol. 2019;30(10):1785-1805. DOI: 10.1681/ASN.2019030238
- Khan SS, Coresh J, Pencina MJ, et al. Novel prediction equations for absolute risk assessment of total cardiovascular disease incorporating cardiovascular-kidney-metabolic health. Circulation. 2023. DOI: 10.1161/CIRCULATIONAHA.123.067626
- Kidney Disease: Improving Global Outcomes (KDIGO) CKD Work Group. KDIGO 2012 clinical practice guideline for the evaluation and management of chronic kidney disease. Kidney Int Suppl. 2013;3:1-150. DOI: 10.1038/kisup.2012.73
- Matsushita K, van der Velde M, Astor BC, et al. Association of estimated glomerular filtration rate and albuminuria with all-cause and cardiovascular mortality in general population cohorts: a collaborative meta-analysis. Lancet. 2010;375(9731):2073-2081. DOI: 10.1016/S0140-6736(10)60674-5
Editorial review: This article was reviewed by the Heart Score Calculator Editorial Team on October 18, 2026. The professional name "Dr. Heart" identifies this editorial work and does not replace advice, diagnosis or treatment from a licensed healthcare professional.