LDL vs HDL Cholesterol: What the Numbers Mean
LDL is the cholesterol fraction most strongly linked to plaque buildup; HDL is associated with lower risk. Learn what each type does, the guideline ranges, the ratios that matter, and how both feed into your heart score.
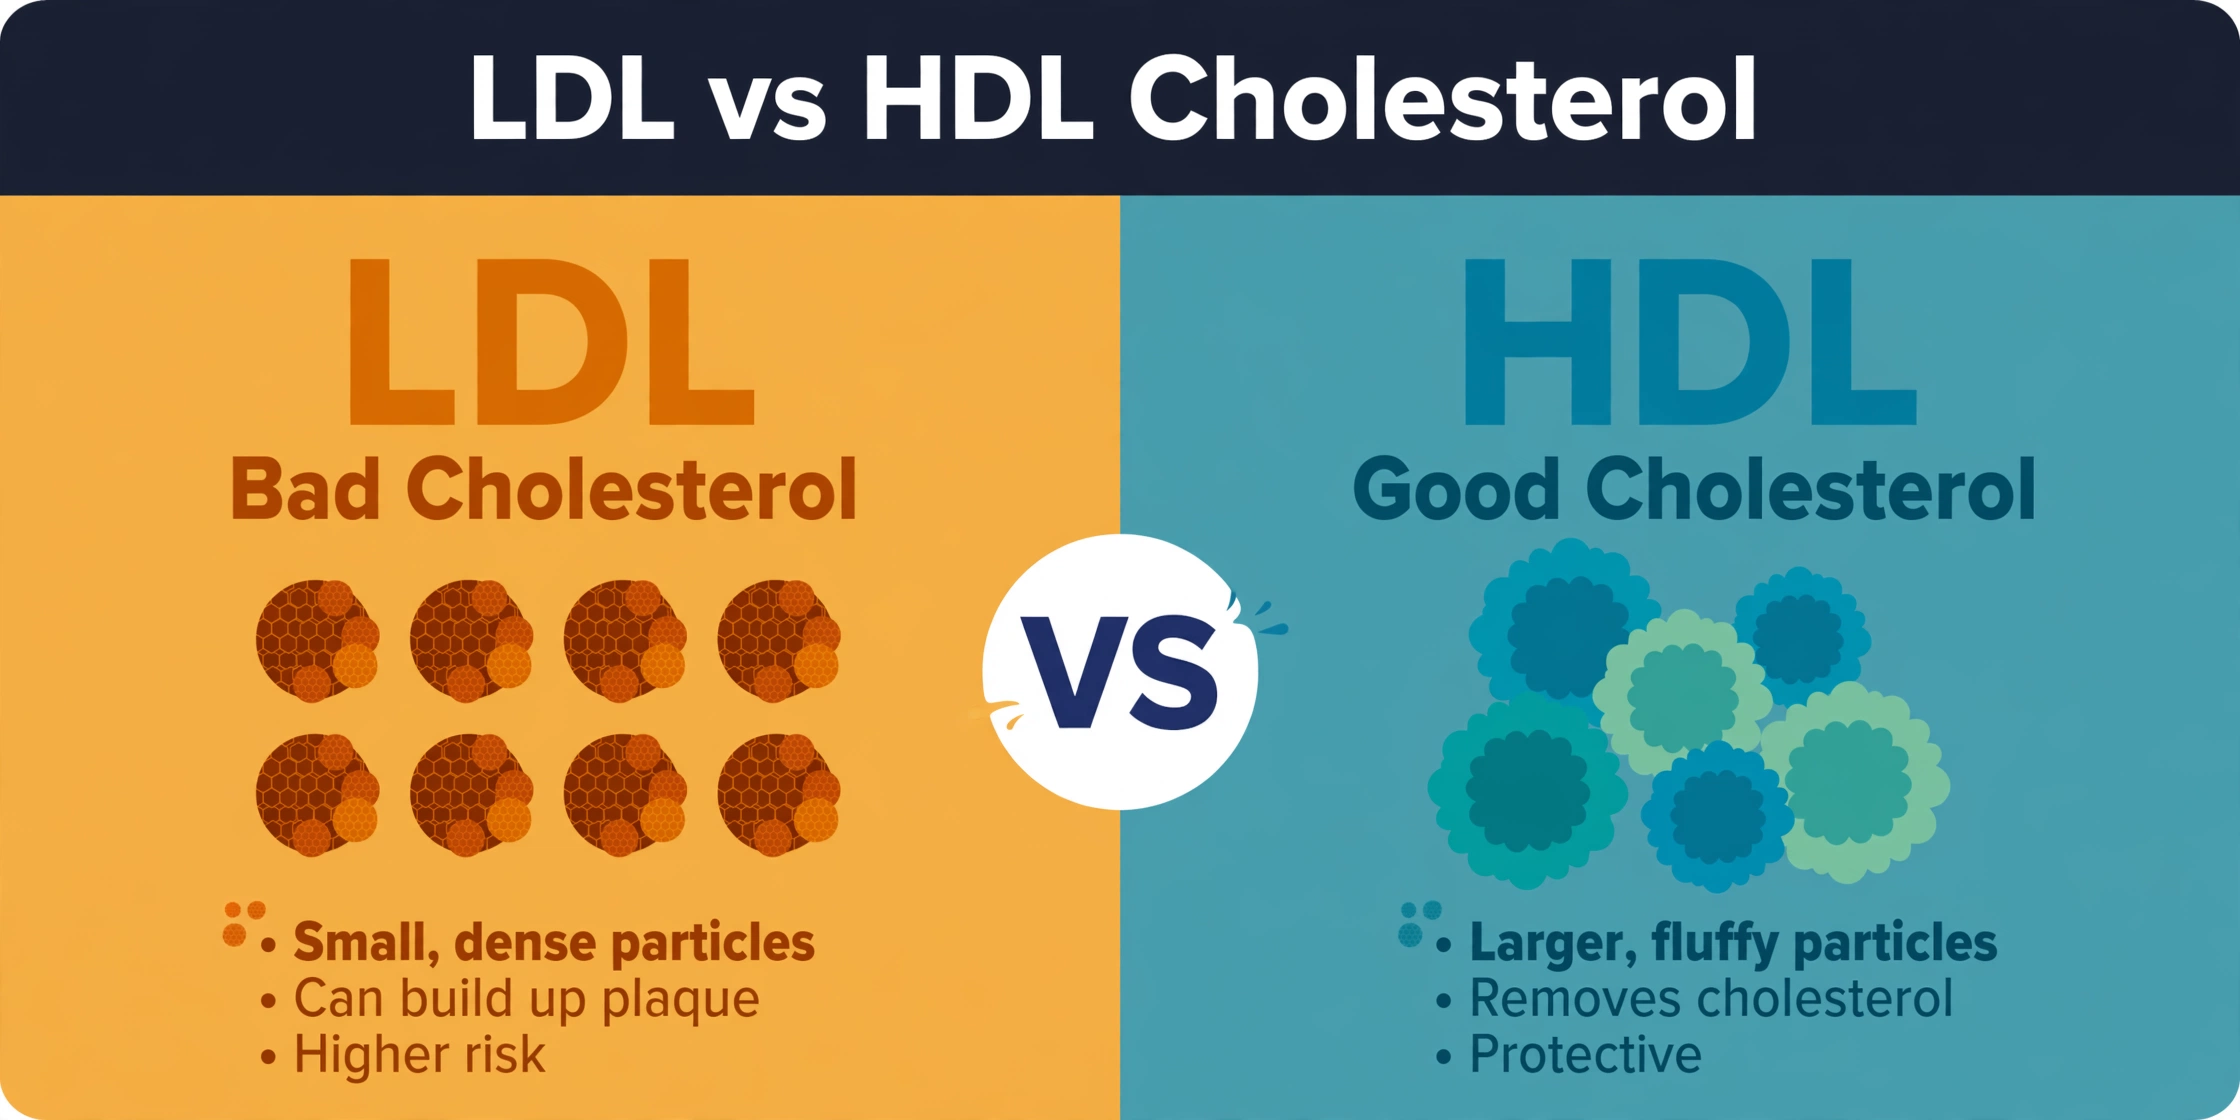
LDL and HDL are two lipoprotein fractions with opposite roles: LDL delivers cholesterol to tissues and can drive plaque, while HDL returns it to the liver.
Key Takeaways
- LDL carries cholesterol to tissues; genetic, population, and trial evidence link higher LDL to plaque buildup and cardiovascular events.
- HDL carries cholesterol back to the liver; higher HDL is associated with lower risk, but extremely high HDL is not always protective.
- Guidelines set LDL below 100 mg/dL as optimal and use non-HDL cholesterol (total minus HDL) as a secondary target.
- Ratios such as total/HDL add context, but risk calculators like the Pooled Cohort Equations use total cholesterol and HDL directly.
- Triglycerides and VLDL remnants are independent risk factors — the lipid panel is a trio, not a pair.
LDL is the cholesterol fraction most strongly linked to plaque buildup in artery walls, while HDL is associated with lower cardiovascular risk. Both matter — along with triglycerides — for a complete picture of blood lipid health.
A standard lipid panel reports total cholesterol, LDL cholesterol, HDL cholesterol, and triglycerides. Many people focus on the total number alone, yet clinical guidelines have moved beyond it. The 2018 AHA/ACC cholesterol guideline centers risk assessment on LDL, HDL, and non-HDL cholesterol rather than the total value.1
This guide explains what LDL and HDL actually are, how they differ, the ranges guidelines use, the ratios clinicians watch, and how both numbers feed into heart risk scores. Each section is grounded in published guidelines and peer-reviewed studies, listed in the sources at the end.
What Is LDL Cholesterol?
LDL stands for low-density lipoprotein. It is one of several particles that carry cholesterol through the bloodstream. Cholesterol does not dissolve in water, so it cannot travel in blood on its own. The liver packages it with proteins and fats into lipoprotein particles that act as delivery vehicles.
Cholesterol itself is not a toxin. Cells use it to build membranes, produce steroid hormones, and make vitamin D. Problems arise from how and where LDL particles deposit their cargo. LDL delivers cholesterol to tissues throughout the body, including the walls of arteries.
LDL is described as atherogenic — capable of driving atherosclerosis. The process starts when LDL particles penetrate the inner lining of an artery. Inside the wall, the particles can become oxidized, which triggers an inflammatory response. Immune cells arrive, engulf the oxidized LDL, and turn into foam cells. Over time, this accumulation forms plaque that narrows the artery.
Not all LDL particles behave the same way. Smaller, denser LDL particles penetrate the arterial wall more easily and circulate longer, making them more atherogenic than larger, buoyant ones. A person can share the same LDL cholesterol number as someone else yet carry a different number of particles — and particle count matters. Each LDL particle carries exactly one molecule of apolipoprotein B (ApoB), so ApoB measurement reflects particle number. The 2018 cholesterol guideline lists elevated ApoB as a risk-enhancing factor that can refine risk estimates.1
The evidence linking LDL to cardiovascular disease comes from three independent lines of research. Genetic studies show that people born with variants causing lifelong lower LDL develop less cardiovascular disease. Population studies show a graded relationship between LDL levels and event rates. Randomized trials show that lowering LDL reduces events. A European Atherosclerosis Society consensus statement combined these strands and concluded that LDL is a causal factor in atherosclerotic cardiovascular disease.2
The Cholesterol Treatment Trialists' (CTT) Collaboration quantified the relationship by pooling 26 trials with 170,000 participants. The analysis found that each 1 mmol/L (about 39 mg/dL) reduction in LDL lowered the risk of major vascular events by roughly 22%, with the effect consistent across patient groups and across different LDL-lowering approaches.3
One practical note: most lab reports estimate LDL with the Friedewald equation (LDL = total cholesterol − HDL − triglycerides/5) rather than measuring it directly. The estimate loses accuracy when triglycerides are high, which is one reason guidelines also track non-HDL cholesterol — a value that needs no calculation assumptions.1
What Is HDL Cholesterol?
HDL stands for high-density lipoprotein. While LDL delivers cholesterol outward to tissues, HDL collects excess cholesterol from tissues and artery walls and carries it back to the liver, where it can be excreted or recycled. This process is called reverse cholesterol transport.
In population studies, higher HDL levels are consistently associated with lower cardiovascular risk. The Framingham Heart Study established this association decades ago,12 and the Emerging Risk Factors Collaboration later confirmed it across more than 300,000 participants: HDL cholesterol showed a strong inverse relationship with vascular events.4
The association is real, but it is not the whole story. Very high HDL is not always protective. A study of two Danish cohorts found that people with extremely high HDL — above roughly 116 mg/dL in men and 135 mg/dL in women — had higher all-cause mortality than people with moderate HDL. The relationship between HDL and risk appears U-shaped: low levels predict higher risk, but extremely high levels do not confer extra protection and may signal other issues.5
Drug trials added another layer of nuance. Medicines designed to raise HDL — including CETP inhibitors such as torcetrapib, dalcetrapib, and evacetrapib, as well as niacin — did not reduce cardiovascular events in large trials despite raising HDL substantially. The AIM-HIGH trial found no benefit from adding niacin to statin therapy, and the HPS2-THRIVE trial found that a niacin-based combination added harms without cardiovascular benefit. These results suggest that the amount of HDL cholesterol in blood matters less than what the HDL particles actually do.13
Researchers now study HDL function rather than HDL quantity. One measure, cholesterol efflux capacity — how effectively HDL removes cholesterol from cells — predicted cardiovascular events more strongly than HDL cholesterol levels in a New England Journal of Medicine study. Function is harder to measure than concentration, so routine lab reports still report the concentration.6
The 2018 cholesterol guideline reflects this evidence. It treats low HDL as a risk marker and uses HDL values in risk equations, but it sets no treatment target for raising HDL. No drug is approved for the purpose of raising HDL to prevent cardiovascular disease.1
Where does this leave the "good cholesterol" label? HDL remains a useful marker: higher levels generally track with lower risk in the middle range. But the label is a simplification. Moderate HDL is associated with lower risk, extremely high HDL is not always protective, and raising HDL with drugs has not reduced events in trials. The honest description is more nuanced — and more useful.
LDL vs HDL: Key Differences
LDL and HDL are often reduced to "bad" and "good," but the full picture is more specific. LDL particles deliver cholesterol to tissues and can drive plaque formation; HDL particles remove cholesterol from tissues and carry it to the liver. One is a delivery vehicle, the other a cleanup crew. The table below compares them across the dimensions clinicians track.
| Feature | LDL | HDL |
|---|---|---|
| Full name | Low-density lipoprotein | High-density lipoprotein |
| Primary role | Carries cholesterol from the liver to tissues | Carries excess cholesterol from tissues back to the liver |
| Risk direction | Higher levels linked to higher cardiovascular risk | Higher levels linked to lower risk within the typical range |
| How it is measured | Usually estimated by the Friedewald equation; direct measurement available | Measured directly on a standard lipid panel |
| Guideline role | Primary treatment target; below 100 mg/dL often cited as optimal | Risk marker in risk equations; 60 mg/dL or higher associated with lower risk |
| Key protein marker | Apolipoprotein B (one per particle) | Apolipoprotein A-I |
| Particle size | Larger than HDL; small dense LDL is more atherogenic | Smallest lipoprotein; function matters beyond concentration |

A useful way to remember the table: LDL pushes cholesterol outward and can build plaque; HDL pulls cholesterol back and supports clearance. Guidelines act on LDL with targets and use HDL as a marker inside risk equations. Both numbers deserve attention, because a favorable HDL does not cancel out a high LDL — and a low LDL does not erase the signal from a very low HDL.
Healthy Ranges for Each
The 2018 AHA/ACC cholesterol guideline uses the following categories for LDL cholesterol, shown here in both mg/dL and mmol/L.1
| LDL Category | mg/dL | mmol/L |
|---|---|---|
| Optimal | Below 100 | Below 2.6 |
| Near optimal / above optimal | 100–129 | 2.6–3.3 |
| Borderline high | 130–159 | 3.4–4.1 |
| High | 160–189 | 4.1–4.9 |
| Very high | 190 or above | 4.9 or above |
For HDL, the guideline uses different thresholds for men and women. Below 40 mg/dL (1.0 mmol/L) in men and below 50 mg/dL (1.3 mmol/L) in women counts as low — a risk marker rather than a treatment target. Levels of 60 mg/dL (1.6 mmol/L) or higher are associated with lower cardiovascular risk.1

These categories describe population-based risk associations, not personal verdicts. A single LDL number never tells the whole story; clinicians evaluate it alongside blood pressure, diabetes status, smoking, family history, and the full risk profile. Age-specific context matters as well — lipid patterns shift across the lifespan, as covered in the guide to normal cholesterol by age.
🧮 Know Your LDL Number?
Enter your lipid panel values to see where your LDL falls in guideline ranges.
Try the LDL Cholesterol Calculator →The Ratios That Matter
Ratios compress two numbers into one. Clinicians have used several of them to summarize the balance between atherogenic and protective lipoproteins.
Total/HDL ratio. Dividing total cholesterol by HDL gives a simple balance score. Population data suggest lower is better: values below 3.5 are often described as favorable, while values above 5 are associated with higher risk. The ratio appears in some risk discussions because it captures both sides of the equation in a single number.12
LDL/HDL ratio. This ratio isolates the two main fractions. Like the total/HDL ratio, lower values are associated with lower risk in observational studies. It appears in research more often than in guideline-driven care, where absolute LDL targets take precedence.
Non-HDL cholesterol. This is the measure guidelines prefer as a secondary target. Non-HDL cholesterol equals total cholesterol minus HDL. It captures LDL plus VLDL and remnant particles in one number, and it needs no fasting and no Friedewald assumptions. The 2018 guideline sets non-HDL targets 30 mg/dL above the corresponding LDL target — so when the LDL goal is below 100, the non-HDL goal is below 130.1
Triglyceride/HDL ratio. This ratio has been studied as a marker of insulin resistance. In overweight adults, a ratio above roughly 3.5 identified insulin-resistant individuals with reasonable accuracy. It is a research tool rather than a guideline target, but it shows how the fractions interact metabolically.14
Ratios add context, but they do not replace the underlying values in formal risk assessment. The Pooled Cohort Equations use total cholesterol and HDL cholesterol as separate inputs, letting the model weight each one. A ratio can hide information: a total/HDL ratio of 4 could mean 200/50 or 120/30, and those are different clinical pictures. Guidelines center treatment decisions on LDL and non-HDL cholesterol, with ratios serving as supplementary context.1
Triglycerides and VLDL: The Third Player
Triglycerides are the third major blood fat. While cholesterol builds cell structures, triglycerides store energy. The liver packages triglycerides into very-low-density lipoprotein (VLDL) particles, which travel through the bloodstream delivering energy to tissues.

As VLDL particles unload triglycerides, they shrink into remnants — and remnants are atherogenic. Nordestgaard and colleagues reviewed evidence showing that elevated non-fasting triglycerides track with higher cardiovascular risk,7 and a Mendelian randomization study by Varbo and colleagues found that remnant cholesterol is a causal risk factor for ischemic heart disease, independent of HDL.8
The 2018 guideline classifies triglyceride levels as follows: normal below 150 mg/dL (1.7 mmol/L), borderline high 150–199 mg/dL, high 200–499 mg/dL, and very high at 500 mg/dL (5.6 mmol/L) or above.1 Very high triglycerides raise concern for pancreatitis — a separate risk from the cardiovascular one.
Trial evidence that triglycerides matter beyond LDL came from REDUCE-IT. In patients with elevated triglycerides who were already taking statins, icosapent ethyl — a purified EPA omega-3 — reduced major ischemic events by 25% compared with placebo. The trial reported its primary result in the New England Journal of Medicine in 2019.9
Triglycerides also affect the rest of the panel. High levels make the Friedewald LDL estimate unreliable, which is why very high triglycerides make direct LDL measurement or non-HDL cholesterol more useful. Current guidelines accept non-fasting samples for most lipid measurements, though very high triglycerides or certain treatment decisions may call for a fasting sample.1
How LDL and HDL Affect Your Heart Score
Heart risk scores translate lipid numbers into probabilities. Both of the main risk models in current guidelines use total cholesterol and HDL cholesterol as inputs — not LDL directly.
The Pooled Cohort Equations (PCE), published in the 2013 ACC/AHA risk assessment guideline, take age, sex, race, total cholesterol, HDL cholesterol, systolic blood pressure, treatment for hypertension, diabetes, and smoking status. The model assigns risk in opposite directions: higher total cholesterol raises the estimated risk, while higher HDL lowers it. Two people with the same LDL can receive different scores if their HDL values differ — the model sees the full panel, not just LDL.10
The 2023 PREVENT equations work the same way at the lipid level: total cholesterol and HDL are core inputs, joined by additional variables such as kidney function. PREVENT estimates both 10-year and 30-year risk, giving clinicians a longer horizon for younger patients.11
This is why the LDL–HDL balance matters for heart scores. A lipid panel with high LDL and high HDL produces a different risk estimate than the same LDL with low HDL. The 2018 cholesterol guideline pairs these equations with LDL thresholds: once the PCE estimate places someone in a risk category, LDL levels guide the intensity of the clinical discussion.1
To see how the numbers combine, the ASCVD risk calculator on this site uses the Pooled Cohort Equations, and the LDL cholesterol calculator explains where an LDL value falls in guideline ranges. For context on what the resulting score means, the guide to what counts as a good heart score walks through each scoring system. Readers interested in lifestyle research around lipids can also review the companion piece on lowering cholesterol naturally.
🧮 Calculate Your LDL & Heart Risk
Check your LDL against guideline ranges, then see how your full lipid panel affects your 10-year risk score.
Try the LDL Cholesterol Calculator →Frequently Asked Questions
Is HDL "good" cholesterol?
What is a dangerous LDL level?
Can HDL be too high?
Does the ratio matter more than LDL alone?
How often should lipids be checked?
Sources
- Grundy SM, Stone NJ, Bailey AL, et al. 2018 AHA/ACC/AACVPR/AAPA/ABC/ACPM/ADA/AGS/APhA/ASPC/NLA/PCNA Guideline on the Management of Blood Cholesterol. Circulation. 2019;139(25):e1082-e1143. DOI: 10.1161/CIR.0000000000000625
- Ference BA, Ginsberg HN, Graham I, et al. Low-density lipoproteins cause atherosclerotic cardiovascular disease. 1. Evidence from genetic, epidemiologic, and clinical studies. A consensus statement from the European Atherosclerosis Society Consensus Panel. Eur Heart J. 2017;38(32):2459-2472. DOI: 10.1093/eurheartj/ehx144
- Baigent C, Blackwell L, Emberson J, et al; Cholesterol Treatment Trialists' (CTT) Collaboration. Efficacy and safety of more intensive lowering of LDL cholesterol: a meta-analysis of data from 170,000 participants in 26 randomised trials. Lancet. 2010;376(9753):1670-1681. DOI: 10.1016/S0140-6736(10)61350-5
- Di Angelantonio E, Sarwar N, Perry P, et al; Emerging Risk Factors Collaboration. Major lipids, apolipoproteins, and risk of vascular disease. JAMA. 2009;302(18):1993-2000. DOI: 10.1001/jama.2009.1619
- Madsen CM, Varbo A, Nordestgaard BG. Extreme high high-density lipoprotein cholesterol is paradoxically associated with high mortality in men and women: two prospective cohort studies. Eur Heart J. 2017;38(32):2478-2486. DOI: 10.1093/eurheartj/ehx119
- Rohatgi A, Khera A, Berry JD, et al. HDL cholesterol efflux capacity and incident cardiovascular events. N Engl J Med. 2014;371(25):2383-2393. DOI: 10.1056/NEJMoa1311036
- Nordestgaard BG, Varbo A. Triglycerides and cardiovascular disease. Lancet. 2014;384(9943):626-635. DOI: 10.1016/S0140-6736(14)61177-6
- Varbo A, Benn M, Tybjærg-Hansen A, Jørgensen AB, Frikke-Schmidt R, Nordestgaard BG. Remnant cholesterol as a causal risk factor for ischemic heart disease. J Am Coll Cardiol. 2013;61(4):427-436. DOI: 10.1016/j.jacc.2012.08.1026
- Bhatt DL, Steg PG, Miller M, et al; REDUCE-IT Investigators. Cardiovascular risk reduction with icosapent ethyl for hypertriglyceridemia. N Engl J Med. 2019;380(1):11-22. DOI: 10.1056/NEJMoa1812792
- Goff DC Jr, Lloyd-Jones DM, Bennett G, et al. 2013 ACC/AHA Guideline on the Assessment of Cardiovascular Risk: a report of the American College of Cardiology/American Heart Association Task Force on Practice Guidelines. Circulation. 2014;129(25 Suppl 2):S49-S73. DOI: 10.1161/01.cir.0000437741.48606.98
- Khan SS, Coresh J, Pencina MJ, et al. Novel prediction equations for absolute risk assessment of total cardiovascular disease incorporating cardiovascular-kidney-metabolic health: a scientific statement from the American Heart Association. Circulation. 2023;148(24):1982-2004. DOI: 10.1161/CIRCULATIONAHA.123.067626
- Wilson PWF, D'Agostino RB, Levy D, Belanger AM, Silbershatz H, Kannel WB. Prediction of coronary heart disease using risk factor categories. Circulation. 1998;97(18):1837-1847. DOI: 10.1161/01.CIR.97.18.1837
- The AIM-HIGH Investigators. Niacin in patients with low HDL cholesterol levels receiving intensive statin therapy. N Engl J Med. 2011;365(24):2255-2267. DOI: 10.1056/NEJMoa1107579; HPS2-THRIVE Collaborative Group. Effects of extended-release niacin with laropiprant in high-risk patients. N Engl J Med. 2014;371(3):203-212. DOI: 10.1056/NEJMoa1300955
- McLaughlin T, Abbasi F, Cheal K, Chu J, Lamendola C, Reaven G. Use of metabolic markers to identify overweight individuals who are insulin resistant. Ann Intern Med. 2003;139(10):802-809. DOI: 10.7326/0003-4819-139-10-200311180-00007
Editorial review: This article was reviewed by the Heart Score Calculator Editorial Team on October 18, 2026. The professional name "Dr. Heart" identifies this editorial work and does not replace advice, diagnosis or treatment from a licensed healthcare professional.