How to Lower Your Heart Score: 7 Proven Steps
Heart scores are computed from risk factors like blood pressure, cholesterol, smoking, and diabetes. Seven evidence-based steps can improve the inputs behind the score.
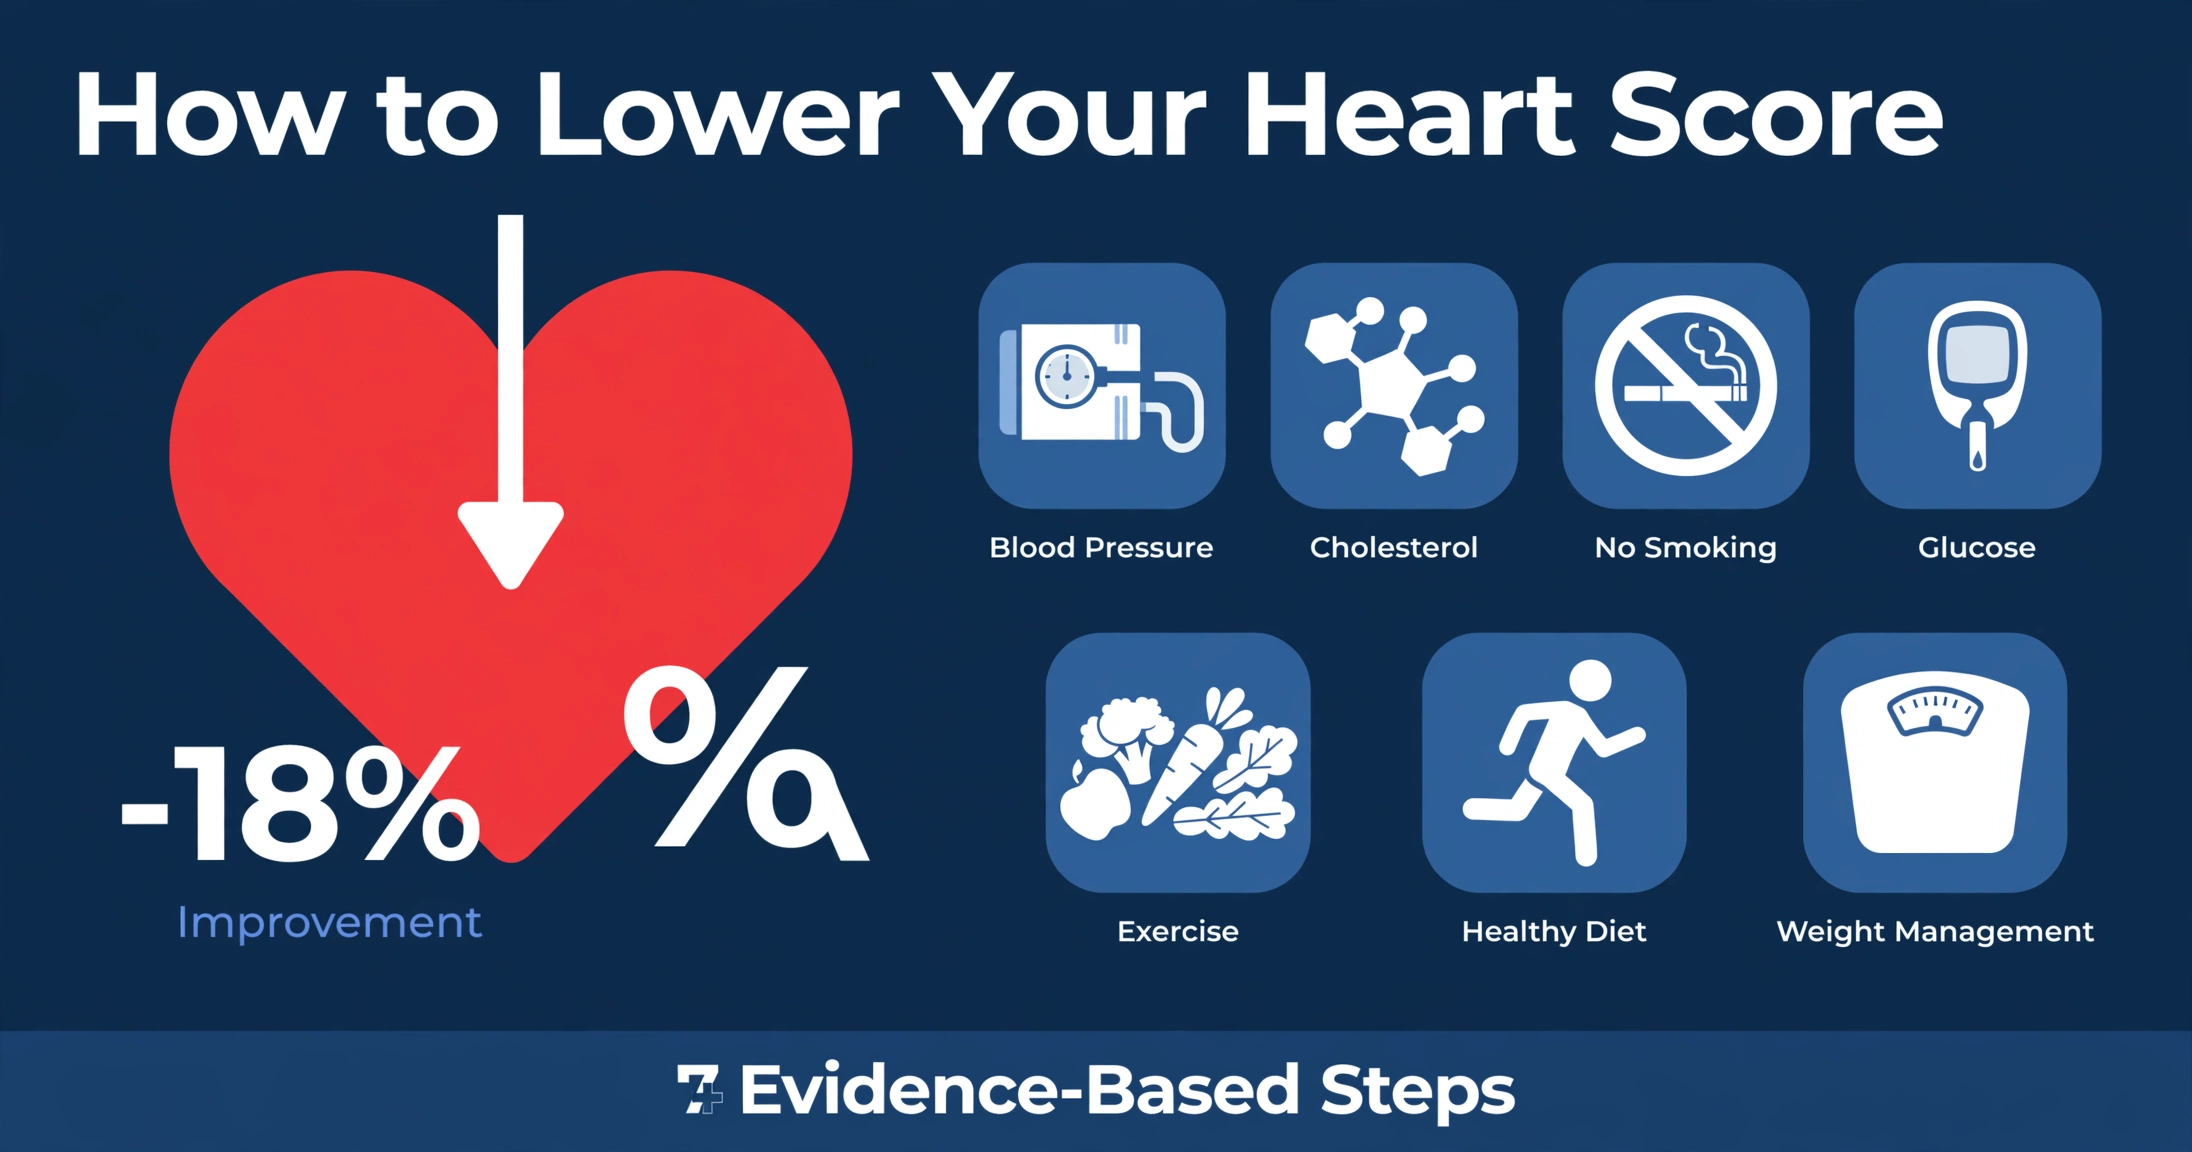
The seven evidence-based steps covered below, and the heart score inputs each one affects.
Key Takeaways
- Heart scores respond to change: blood pressure, cholesterol, smoking, diabetes, and weight inputs all shift the calculated result.
- Trials show specific magnitudes: intensive blood pressure control cut cardiovascular events 25% (SPRINT); the Mediterranean diet cut major events by about 30% (PREDIMED).
- Smoking cessation and diabetes prevention have some of the largest documented effects on cardiovascular outcomes.
- Diet, activity, and weight act through measured inputs — blood pressure, lipids, and blood sugar — rather than as direct score entries.
- Age is not modifiable, so scores naturally rise over time; guidelines suggest reassessing risk every 4 to 6 years.
A heart score is computed from risk factors — blood pressure, cholesterol, smoking, diabetes, and age — and several of these respond to change. Randomized trials show that improving blood pressure, cholesterol, blood sugar, diet, and activity lowers cardiovascular risk, which lowers the estimated score. Age is the one input that only moves in one direction.
Scores respond through their inputs. When systolic pressure falls, when total cholesterol falls, or when smoking status changes from current to former, the Pooled Cohort Equations produce a lower number. Inputs that move indirectly — diet, exercise, and weight — change the score through measured blood pressure, lipids, and blood sugar. The sections below describe seven evidence-based steps, the trials behind them, and how each one reaches the score. For context on what the resulting numbers mean, the guide to good heart score ranges explains each scoring system's categories.
| Risk Factor | Heart Score Input It Affects | How It Shows Up |
|---|---|---|
| Blood pressure | Systolic blood pressure; treatment status | Direct input to the equations |
| Cholesterol | Total cholesterol; HDL cholesterol | Direct input to the equations |
| Smoking | Smoking status (current or not) | Direct input; binary |
| Diabetes | Diabetes status (yes or no) | Direct input; binary |
| Age | Age in years | Direct input; not modifiable |
| Diet pattern | Blood pressure, lipids, weight | Indirect — through measured values |
| Physical activity | Blood pressure, lipids, weight, blood sugar | Indirect — through measured values |
| Body weight | Blood pressure, lipids, diabetes risk | Indirect — BMI itself is not an input |
Step 1: Blood Pressure
Systolic blood pressure is one of the strongest adjustable inputs in the Pooled Cohort Equations, the model behind the 10-year ASCVD risk estimate. The equations use two blood pressure values: measured systolic pressure and whether it is being treated. Lower systolic readings produce lower estimated risk.
The strongest trial evidence comes from SPRINT, published in 2015. The Systolic Blood Pressure Intervention Trial randomized 9,361 adults with hypertension and elevated cardiovascular risk to an intensive systolic target below 120 mm Hg or a standard target below 140 mm Hg. Over a median of 3.26 years, the intensive group had a 25% lower rate of the primary composite outcome — heart attack, stroke, heart failure, or cardiovascular death (1.65% per year versus 2.19% per year; hazard ratio 0.75; 95% CI, 0.64 to 0.89).1
Dietary patterns move blood pressure too. The DASH-Sodium trial combined the DASH eating pattern with three sodium levels. Reducing sodium lowered systolic pressure, and the DASH pattern itself lowered systolic pressure by 5.5 mm Hg in participants with hypertension and 3.5 mm Hg in those without.2
The 2017 ACC/AHA hypertension guideline defines four blood pressure categories: normal below 120/80 mm Hg, elevated 120-129/<80, Stage 1 hypertension 130-139/80-89, and Stage 2 hypertension 140/90 mm Hg or higher.9 These thresholds determine how clinicians classify and track blood pressure over time.
Because systolic pressure is a direct input to heart score models, measured changes translate directly into changes in the calculated score. Blood pressure is also one of the faster-moving inputs, with readings shifting within weeks as treatment or dietary patterns change. The mean arterial pressure calculator on this site estimates average arterial pressure from systolic and diastolic readings.
Step 2: Cholesterol
LDL cholesterol is the lipid fraction most closely linked to atherosclerosis, and guidelines treat it as the primary cholesterol target. The Pooled Cohort Equations use total cholesterol and HDL cholesterol as inputs, while clinical attention usually centers on LDL, which makes up most of total cholesterol in most people.
The Cholesterol Treatment Trialists' collaboration pooled individual participant data from dozens of lipid-lowering trials. Each 1 mmol/L reduction in LDL cholesterol — about 39 mg/dL — was associated with roughly a 22% relative reduction in major vascular events, a finding reproduced across baseline risk levels and populations. The 2018 AHA/ACC cholesterol guideline summarizes this dose-response evidence as the basis for LDL-directed prevention.10
The guideline organizes prevention around LDL thresholds and risk categories. It identifies LDL cholesterol of 190 mg/dL or higher as severe hypercholesterolemia, discusses statin therapy for adults with 10-year ASCVD risk at or above 7.5% alongside risk-enhancing factors, and sets LDL below 70 mg/dL as the target for patients at very high risk who are already on treatment.10 These thresholds describe how clinicians use numbers in practice.
Lowering LDL lowers the total cholesterol input of risk equations, which lowers the calculated score. HDL cholesterol also matters: higher HDL is associated with lower estimated risk in the equations. The LDL cholesterol calculator on this site estimates LDL from total cholesterol, HDL cholesterol, and triglycerides using standard clinical formulas.
Step 3: Smoking Cessation
Smoking status is a binary input in the Pooled Cohort Equations: current smoker or not. Smoking raises cardiovascular risk through damage to blood vessel linings, higher inflammation, and increased clotting tendency.
A widely cited meta-analysis by Critchley and Capewell, published in JAMA in 2003, examined 20 studies of patients with coronary heart disease. Among patients who stopped smoking after a coronary diagnosis, mortality was 36% lower than among those who continued smoking (odds ratio 0.64; 95% CI, 0.58 to 0.71).6 The analysis suggested that the survival advantage of quitting after a cardiac event rivals that of several established therapies.
Risk declines over time after cessation. In population studies, the cardiovascular risk of former smokers falls progressively with each smoke-free year, approaching but not fully reaching the risk of never-smokers over a decade or more. The equations do not distinguish recent quitters from long-term quitters; they record status only.
Because the input is binary, a change in smoking status produces an immediate change in the calculated score. This makes smoking status one of the most visible score movements: the equations reflect the new status as soon as it is entered, while the underlying biological risk continues to decline over the following years.

Step 4: Blood Sugar and Diabetes
Diabetes status is a yes-or-no input in the Pooled Cohort Equations, and diabetes roughly doubles cardiovascular risk. The equations do not capture diabetes duration, diabetes type, or glycemic control, yet the input carries substantial weight in the final estimate.
The Diabetes Prevention Program (DPP) tested whether lifestyle intervention or metformin could prevent diabetes in 3,234 adults with elevated fasting and post-load glucose. Over an average of 2.8 years, intensive lifestyle intervention reduced diabetes incidence by 58% compared with placebo, while metformin reduced it by 31%.4 The lifestyle program aimed for modest weight loss and regular physical activity, and it worked across age and ethnic groups in the trial.
The Look AHEAD trial studied a different question: 5,145 adults who already had type 2 diabetes with overweight or obesity received either intensive lifestyle intervention or diabetes support and education. The intervention group lost more weight and improved fitness, but the trial found no reduction in the primary cardiovascular outcome (hazard ratio 0.95; 95% CI, 0.83 to 1.09) and was stopped early.5
Together, these trials trace a clear pattern: preventing diabetes has strong trial support, while reversing cardiovascular risk after diabetes is established has proven harder to demonstrate. For heart scores, diabetes prevention affects the estimate through the diabetes input itself. Improvements in blood sugar among people who already have diabetes mainly move the score through related inputs such as weight and blood pressure.
🧮 Recheck Your Heart Score
Changed a risk factor? Recalculate your 10-year ASCVD risk to see how the numbers move.
Try the ASCVD Calculator →Step 5: Diet Pattern
Dietary patterns influence blood pressure, lipids, and weight — the inputs that feed heart score equations. The strongest evidence comes from randomized trials of whole eating patterns rather than single foods or nutrients.
PREDIMED enrolled 7,447 adults at high cardiovascular risk in Spain and assigned them to a Mediterranean diet supplemented with extra-virgin olive oil, a Mediterranean diet supplemented with mixed nuts, or a control diet. In the 2018 reanalysis, the olive-oil group had a hazard ratio of 0.69 (95% CI, 0.53 to 0.91) and the nuts group 0.72 (95% CI, 0.54 to 0.95) for the primary composite of heart attack, stroke, or cardiovascular death.3
The DASH trial tested an eating pattern rich in fruits, vegetables, and low-fat dairy against a control pattern. The DASH pattern lowered systolic blood pressure by 5.5 mm Hg in participants with hypertension — a shift large enough to move a heart score through the blood pressure input alone.2
Guidelines describe these patterns rather than prescribing meals. The 2018 cholesterol guideline identifies Mediterranean-style and DASH-style patterns as eating patterns associated with lower cardiovascular risk.10 Scores respond to diet through measured changes in blood pressure and lipids, not through the diet label itself. A pattern only moves the score when the numbers it changes are measured and entered.
Step 6: Physical Activity
Physical activity does not appear as a direct input in the Pooled Cohort Equations, but it influences nearly every input that does: blood pressure, lipids, blood sugar, and weight. The evidence for activity comes from large pooled analyses of cohort studies.
Arem and colleagues pooled data from six prospective studies covering 661,137 adults. Compared with no leisure-time activity, volumes below guideline levels were associated with 20% lower mortality, guideline-level volumes with 31% lower mortality, and three to five times guideline levels with 39% lower mortality.7 The analysis showed diminishing additional benefit beyond very high volumes — most of the gain came from moving out of inactivity.
Sattelmair and colleagues conducted a meta-analysis of walking studies focused specifically on coronary heart disease. Walking at guideline-recommended volumes was associated with lower coronary risk, and the benefit followed a dose-response pattern across walking durations.8
Guidelines quantify activity in weekly volumes: at least 150 minutes of moderate-intensity aerobic activity, 75 minutes of vigorous-intensity activity, or an equivalent combination. For heart scores, the mechanism is indirect but well documented — sustained activity shifts the blood pressure, lipid, and weight inputs that the equations measure. Patients often discuss an activity plan that fits their medical history with their clinician before increasing intensity.
Step 7: Body Weight
Body mass index is not a direct input in the Pooled Cohort Equations, yet weight correlates strongly with the inputs that are: blood pressure, lipids, and diabetes risk. Trials of weight management consistently show improvements across these inputs.
The Look AHEAD trial provides the clearest data in people with diabetes. Intensive lifestyle intervention produced greater weight loss and fitness gains than the control condition, along with improvements in blood pressure, lipids, and glycemic control — even though the trial did not reduce the primary cardiovascular outcome.5 The risk-factor improvements themselves are what move heart score estimates.
Population data show a graded relationship between BMI and cardiovascular risk factors. As BMI rises, average systolic pressure, triglycerides, and diabetes prevalence rise alongside it. The BMI calculator on this site classifies weight status using standard cutoffs.
Because weight affects the score indirectly, score movement from weight change arrives through measured changes in blood pressure, cholesterol, and diabetes status rather than through a weight entry. This is why clinicians track the laboratory and pressure values — not just the scale — when following a score over time.
| Trial | Intervention | Key Result |
|---|---|---|
| SPRINT (2015) | Intensive systolic target below 120 vs below 140 mm Hg | 25% lower rate of the primary cardiovascular composite (HR 0.75) |
| DASH-Sodium (2001) | DASH eating pattern combined with three sodium levels | Sodium reduction and the DASH pattern each lowered systolic blood pressure |
| PREDIMED (2018) | Mediterranean diet plus olive oil or nuts vs control diet | HR 0.69 (olive oil) and 0.72 (nuts) for major cardiovascular events |
| DPP (2002) | Intensive lifestyle intervention or metformin vs placebo | 58% lower diabetes incidence with lifestyle; 31% with metformin |
| Critchley & Capewell (2003) | Smoking cessation vs continued smoking after coronary diagnosis | 36% lower mortality after quitting (OR 0.64) |
| Arem et al. (2015) | Leisure-time activity at varying weekly volumes | 20% to 39% lower mortality across activity doses |
| Look AHEAD (2013) | Intensive lifestyle intervention in type 2 diabetes | No reduction in primary cardiovascular outcome (HR 0.95); improved risk factors |
Tracking Change Over Time
Heart scores are snapshots. They describe estimated risk at the moment the inputs were measured, and they change as inputs change. Guidelines suggest reassessing risk every 4 to 6 years for adults without known cardiovascular disease, and sooner when blood pressure, cholesterol, smoking, or diabetes status changes.10
Some risk tools convert a profile into heart age — the calendar age at which the estimated risk would be average. A heart age older than actual age signals that risk factors are pulling the estimate upward. The ASCVD risk calculator on this site computes 10-year risk from the Pooled Cohort Equations, the same model covered in the sections above.
Small changes across several inputs often move a score more than a large change in one. Tracking the score over time gives a single number that reflects the combined direction of blood pressure, cholesterol, smoking, diabetes, and age.
🧮 Calculate Your Heart Score
See your 10-year ASCVD risk using the Pooled Cohort Equations.
Try the ASCVD Calculator →Frequently Asked Questions
How quickly can a heart score change?
Does quitting smoking lower the score right away?
Which step matters most?
Can diet alone change the score?
Do I need medication?
How often should I recalculate my heart score?
Sources
- SPRINT Research Group. A randomized trial of intensive versus standard blood-pressure control. N Engl J Med. 2015;373:2103-2116. DOI: 10.1056/NEJMoa1511939
- Sacks FM, Svetkey LP, Vollmer WM, et al. Effects on blood pressure of reduced dietary sodium and the Dietary Approaches to Stop Hypertension (DASH) diet. N Engl J Med. 2001;344:3-10. DOI: 10.1056/NEJM200101043440101
- Estruch R, Ros E, Salas-Salvadó J, et al. Primary prevention of cardiovascular disease with a Mediterranean diet supplemented with extra-virgin olive oil or nuts. N Engl J Med. 2018;378:e34. DOI: 10.1056/NEJMoa1800389
- Diabetes Prevention Program Research Group. Reduction in the incidence of type 2 diabetes with lifestyle intervention or metformin. N Engl J Med. 2002;346:393-403. DOI: 10.1056/NEJMoa012512
- Look AHEAD Research Group. Cardiovascular effects of intensive lifestyle intervention in type 2 diabetes. N Engl J Med. 2013;369:145-154. DOI: 10.1056/NEJMoa1212914
- Critchley JA, Capewell S. Mortality risk reduction associated with smoking cessation in patients with coronary heart disease: a systematic review. JAMA. 2003;290(1):86-97. DOI: 10.1001/jama.290.1.86
- Arem H, Moore SC, Patel A, et al. Leisure time physical activity and mortality: a detailed pooled analysis of the dose-response relationship. JAMA Intern Med. 2015;175(6):959-967. DOI: 10.1001/jamainternmed.2015.0533
- Sattelmair J, Pertman J, Ding EL, Kohl HW 3rd, Haskell W, Lee IM. Dose response between physical activity and risk of coronary heart disease: a meta-analysis. Circulation. 2011;124(7):789-795. DOI: 10.1161/CIRCULATIONAHA.110.983837
- Whelton PK, Carey RM, Aronow WS, et al. 2017 ACC/AHA/AAPA/ABC/ACPM/AGS/APhA/ASH/ASPC/NMA/PCNA guideline for the prevention, detection, evaluation, and management of high blood pressure in adults. Hypertension. 2018;71(6):e13-e115. DOI: 10.1161/HYP.0000000000000065
- Grundy SM, Stone NJ, Bailey AL, et al. 2018 AHA/ACC/AACVPR/AAPA/ABC/ACPM/ADA/AGS/APhA/ASPC/NLA/PCNA guideline on the management of blood cholesterol. Circulation. 2019;139(25):e1082-e1143. DOI: 10.1161/CIR.0000000000000625
- Goff DC Jr, Lloyd-Jones DM, Bennett G, et al. 2013 ACC/AHA guideline on the assessment of cardiovascular risk. Circulation. 2014;129(25 Suppl 2):S49-S73. DOI: 10.1161/01.cir.0000437741.48606.98
Editorial review: This article was reviewed by the Heart Score Calculator Editorial Team on October 18, 2026. The professional name “Dr. Heart” identifies this editorial work and does not replace advice, diagnosis or treatment from a licensed healthcare professional.