Normal Cholesterol by Age: Complete Chart (2026)
Desirable cholesterol ranges come from guideline thresholds, not from age-adjusted targets. Population averages for total and LDL cholesterol rise through the 50s and ease down afterward, while HDL and triglycerides follow their own patterns by age and sex.
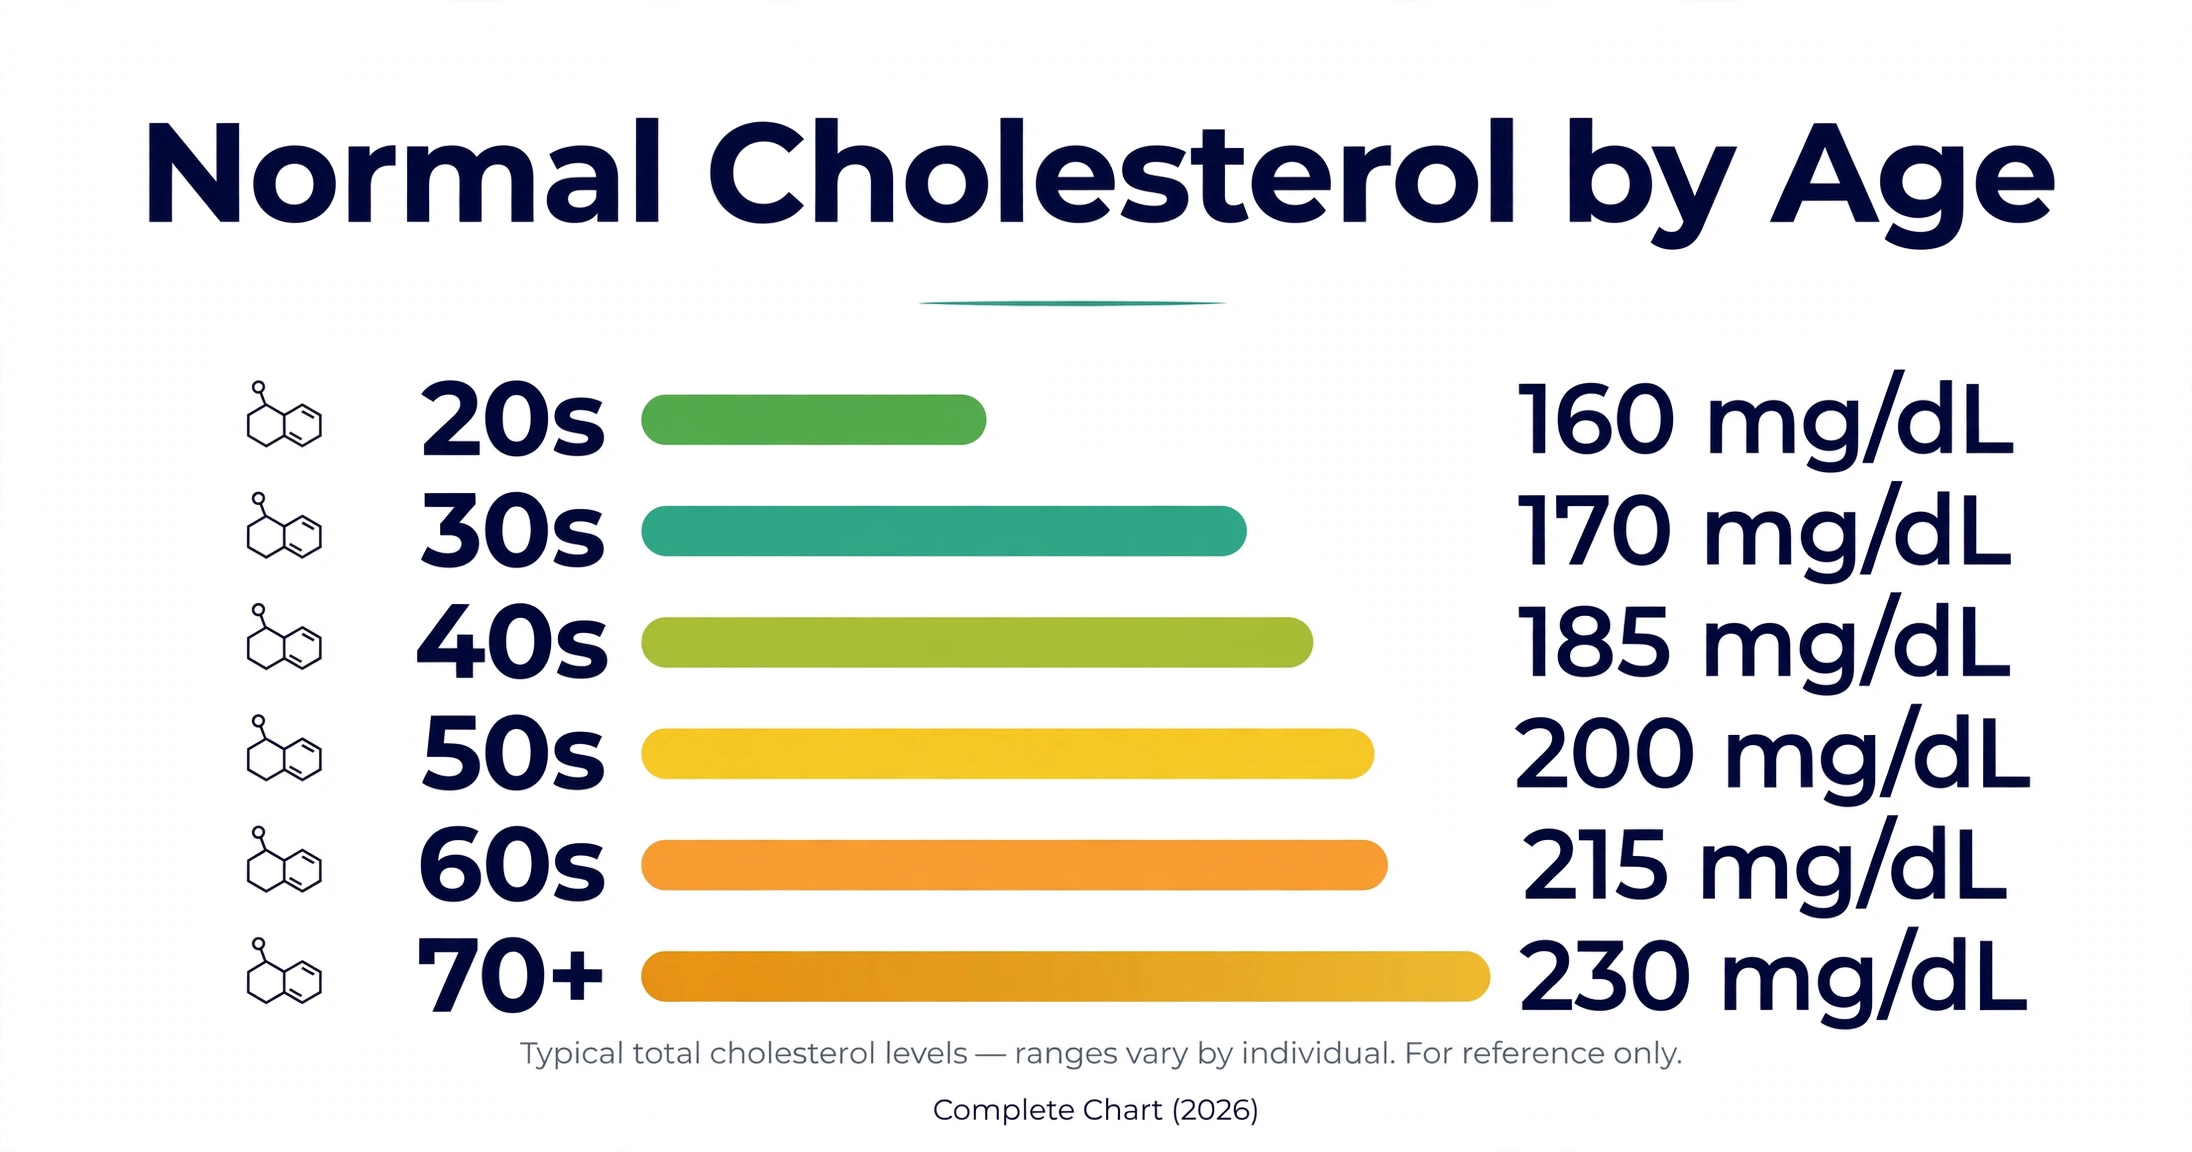
Cholesterol guideline thresholds stay the same across adult ages, while population averages shift by decade. Desirable ranges are set by guidelines, not by age.
Key Takeaways
- Guideline thresholds are fixed, not age-adjusted: desirable total cholesterol below 200 mg/dL and optimal LDL below 100 mg/dL apply at every adult age.
- Population averages for total cholesterol rise through the 50s and decline slightly afterward — averages describe what is typical, not what is desirable.
- An LDL of 190 mg/dL or higher at any age prompts evaluation for possible familial hypercholesterolemia.
- An HDL of 60 mg/dL or higher counts as a favorable factor; below 40 mg/dL in men or below 50 mg/dL in women is a risk factor.
- Triglycerides below 150 mg/dL are normal; levels of 500 mg/dL or higher raise concern about pancreatitis risk.
What counts as normal cholesterol depends on the lipid fraction being measured and whether the question is about a guideline range or a population average. Guidelines define desirable ranges for total, LDL, and HDL cholesterol and triglycerides using fixed thresholds that apply across adult ages rather than age-adjusted targets. Population averages, on the other hand, shift by decade, with total cholesterol typically rising through middle age and declining slightly in later years.
This article presents both perspectives. The guideline tables show the fixed thresholds clinicians use to classify lipid values. The age tables show approximate population averages by decade, so readers can see how typical values move with age without mistaking an average for a target.
What "Normal" Cholesterol Means
What "normal" means depends on which of three concepts a person has in mind. A population average describes the middle of the distribution in a group, such as adults in their 40s. A desirable range describes values associated with lower cardiovascular risk in clinical guidelines. A treatment threshold describes a value at which clinicians and patients begin discussing therapy. These three concepts often get mixed together, and mixing them causes confusion.
The National Cholesterol Education Program's Adult Treatment Panel III (ATP III), published in 2002, set the classic framework that still shapes how lipid values are labeled.3 Under ATP III, total cholesterol below 200 mg/dL is classified as desirable, 200 to 239 mg/dL as borderline high, and 240 mg/dL or higher as high. These cutoffs apply to adults at every age. The panel did not create separate desirable ranges for each decade of life.
Later guidelines shifted treatment decisions toward overall cardiovascular risk rather than fixed LDL targets. The 2013 ACC/AHA cholesterol guideline moved away from treat-to-target numbers and identified groups most likely to benefit from statin therapy, including people with clinical ASCVD, LDL cholesterol of 190 mg/dL or higher, diabetes, or an estimated 10-year ASCVD risk of 7.5 percent or higher.2 The 2018 cholesterol guideline kept this risk-based framework and refined it with additional risk-enhancing factors.1
Age plays an important role in this framework, but not as a modifier of lipid thresholds. The Pooled Cohort Equations use age as one of the strongest predictors of 10-year ASCVD risk, so the same LDL value produces a higher estimated risk at age 65 than at age 45. The threshold that defines "high" LDL stays the same, while the clinical response to that value changes with the overall risk picture. Guidelines identify desirable ranges by lipid fraction, and clinicians evaluate each person's risk by combining lipids with age, blood pressure, and other factors.
Total Cholesterol by Age
Total cholesterol measures all cholesterol carried in the blood, including the LDL, HDL, and VLDL fractions. Unlike guideline thresholds, which are fixed, the average total cholesterol in the population moves with age. National survey data collected by the National Center for Health Statistics show a familiar pattern: averages climb from the 20s through the 50s, then ease downward in the 60s and beyond.10,11
| Age Group | Approximate Average Total Cholesterol (mg/dL) |
|---|---|
| 20s | 185–195 |
| 30s | 195–205 |
| 40s | 200–210 |
| 50s | 205–215 |
| 60s | 200–210 |
| 70s and older | 195–205 |
Approximate population averages from national survey data (NCHS/NHANES). These are averages, not clinical targets. The ATP III desirable threshold of below 200 mg/dL applies at every age.3,10,11
Several points about this table deserve emphasis. First, these are ranges of averages, not measurements of any individual. Averages hide wide variation between people within each age group. Second, these numbers are not targets. The desirable threshold of below 200 mg/dL from ATP III applies at every age, and an average above 200 in a given decade does not make that level desirable.3 Third, the pattern itself is consistent across decades of survey data: total cholesterol rises through middle age, peaks around the 50s, and declines modestly afterward.
The decline at older ages has more than one explanation. Selective survival plays a role: people with very high cholesterol are less likely to reach older ages in survey samples. Changes in diet, body weight, and medication use also contribute. Researchers also note that total cholesterol in the oldest age groups reflects a mix of physiology and cohort history, since different generations lived through different dietary eras.
For context, national statistics show that a large share of adults have total cholesterol at or above 200 mg/dL, and population averages have improved over recent decades as statin use increased and trans fats declined.8 The population average sits near the borderline-high threshold, which is one reason guidelines frame desirability by risk rather than by what is typical.

LDL Cholesterol: Targets and Thresholds
LDL cholesterol is the lipid fraction most directly tied to atherosclerosis. Genetic and observational evidence identifies LDL as a causal factor in the development of arterial plaque, a conclusion supported by a consensus statement from the European Atherosclerosis Society.5 Because of this central role, LDL thresholds receive the most attention in clinical guidelines.
| Category | LDL Cholesterol (mg/dL) |
|---|---|
| Optimal | Less than 100 |
| Near optimal / above optimal | 100–129 |
| Borderline high | 130–159 |
| High | 160–189 |
| Very high | 190 or higher |
NCEP ATP III classification. These thresholds are risk-based and do not change with age.3
The key feature of these cutoffs is that they do not change with age. An LDL of 145 mg/dL is borderline high whether the person is 35 or 65. What changes with age is the clinical response to that number. The 2018 cholesterol guideline identifies specific LDL situations that prompt therapy discussions: an LDL of 190 mg/dL or higher at any age suggests possible primary hypercholesterolemia and calls for intensive evaluation.1 For adults with LDL between 70 and 189 mg/dL, the guideline uses estimated 10-year ASCVD risk to guide discussions: a risk of 20 percent or higher generally supports statin initiation, while a risk between 7.5 and 20 percent calls for a clinician-patient discussion that weighs risk-enhancing factors.
This risk-based approach replaced the older model of a single LDL goal for everyone. The 2013 guideline made this change explicitly, identifying four statin benefit groups rather than asking clinicians to push LDL below one number.2 The 2018 guideline added more detail, including coronary artery calcium scoring as a tiebreaker when the decision about statin therapy is uncertain in the intermediate-risk range.1
One more distinction matters. Some readers still ask for an "LDL goal by age." Guidelines do not provide one. The National Lipid Association's recommendations also frame targets around risk category rather than age decade.9 Age enters the equation through the risk estimator, not through the LDL table. The LDL cholesterol calculator on this site shows how the classification of a single value works under these thresholds.
🧮 Calculate Your LDL Cholesterol
See how your LDL value is classified using guideline thresholds, from optimal to very high.
Try the LDL Cholesterol Calculator →HDL Cholesterol by Age and Sex
HDL cholesterol behaves differently from LDL. Higher HDL levels are associated with lower cardiovascular risk, which is why ATP III treats an HDL of 60 mg/dL or higher as a "negative" risk factor — one that counts in the favorable direction.3 The classification table uses different cutoffs for men and women.
| Classification | Men | Women |
|---|---|---|
| Low (major risk factor) | Less than 40 mg/dL | Less than 50 mg/dL |
| Acceptable | 40–59 mg/dL | 50–59 mg/dL |
| High (favorable) | 60 mg/dL or higher | 60 mg/dL or higher |
NCEP ATP III classification. Sex-specific cutoffs reflect measured differences in HDL distributions between men and women.3
Across the lifespan, HDL changes less dramatically than total or LDL cholesterol, but patterns exist. Men have lower average HDL than women at every adult age, and this gap is already present in young adulthood. Women's HDL averages tend to decline after menopause as estrogen levels fall, narrowing the sex gap somewhat in later decades. Men show a relatively flat pattern across adult ages, with modest variation from decade to decade.
The association between HDL and cardiovascular outcomes comes from large cohort studies. The Emerging Risk Factors Collaboration combined data from 68 long-term studies and found that higher HDL cholesterol was associated with lower risk of coronary heart disease after accounting for other factors.6 Earlier Framingham analyses showed that HDL levels predicted cardiovascular mortality, establishing HDL as an independent risk marker.7
A caution is in order. Observational associations do not prove that raising HDL through therapy reduces risk. Clinical trials of drugs designed to raise HDL have not shown the expected cardiovascular benefit, which is why current guidelines do not recommend HDL-raising therapy as a treatment target.1 Clinicians evaluate HDL as one piece of the lipid profile, not as an isolated number. The standard interpretation remains: low HDL is a risk factor, higher HDL is generally favorable, and the full panel matters more than any single fraction.
Triglycerides by Age
Triglycerides are the main form of fat carried in the blood, and their classification comes from an American Heart Association scientific statement that standardized the categories still used today.4 Unlike cholesterol thresholds, triglyceride values depend heavily on whether the blood sample was drawn after fasting.
| Category | Fasting Triglycerides (mg/dL) |
|---|---|
| Normal | Less than 150 |
| Borderline high | 150–199 |
| High | 200–499 |
| Very high | 500 or higher |
AHA scientific statement (Miller et al., Circulation 2011). These thresholds are not age-specific.4
Population averages for triglycerides rise from young adulthood into middle age, then stabilize or decline slightly after the 60s. Men typically have higher average triglycerides than women until around middle age, after which the gap narrows. Fasting triglycerides are the standard for classification, though nonfasting samples are increasingly used in clinical practice with slightly different interpretation ranges.
The 2011 AHA statement describes triglycerides as a marker of risk rather than a direct target on par with LDL. Elevated triglycerides often travel with other risk factors: low HDL, insulin resistance, and higher body weight. When triglycerides reach 500 mg/dL or higher, the clinical concern shifts partly toward pancreatitis risk, and guidelines identify this level as one where triglyceride-lowering therapy is typically addressed.4
The 2018 cholesterol guideline treats persistent triglycerides of 175 mg/dL or higher (nonfasting) as a risk-enhancing factor in adults aged 40 to 75, meaning it adds weight to the statin discussion even when LDL is the primary focus.1 This reflects the view that triglycerides refine the risk picture rather than drive it alone. As with other lipid fractions, the cutoffs stay the same across adult ages, and clinicians evaluate the value within the person's overall risk profile.
Why Cholesterol Changes With Age
Cholesterol levels change with age for reasons rooted in human physiology. Describing these mechanisms helps explain the patterns in the tables above.
Sex hormones play a central role. Estrogen tends to raise HDL and lower LDL, which is one reason premenopausal women generally have more favorable lipid profiles than men of the same age. After menopause, as estrogen production declines, LDL cholesterol typically rises and HDL drifts downward. This shift is well documented in cohort studies and helps explain why women's cardiovascular risk profile changes in the decade after menopause. In men, the gradual decline of testosterone with age is associated with less favorable lipid changes, though the pattern is more gradual than the menopausal transition.
The liver's handling of cholesterol also changes. Hepatic LDL receptors clear LDL particles from the blood, and the activity of these receptors tends to decline with age. Less efficient clearance means more LDL remains in circulation, contributing to the rise seen through middle age. Cholesterol synthesis and absorption patterns shift as well, though these changes are modest compared with the receptor effect.
Body composition changes add to the effect. Adults tend to gain fat mass and lose lean mass with age, and higher body fat is associated with higher triglycerides and LDL and lower HDL. Physical activity typically declines across the decades, and lower activity is associated with lower HDL and higher triglycerides. Insulin sensitivity also tends to decline, which affects triglyceride metabolism in particular.
Dietary patterns evolve across the lifespan too, sometimes improving and sometimes worsening lipid profiles. Taken together, these mechanisms explain why population averages rise through the 50s. They also explain why the decline after age 60 is only modest: the underlying physiology continues to push levels upward even as other factors, including medication use and selective survival, pull the average down.
What the Guidelines Say in 2026
The 2018 AHA/ACC/Multisociety cholesterol guideline remains the current framework for cholesterol management in the United States, and its recommendations shape how clinicians interpret lipid values in 2026.1 The guideline's central principle is that treatment decisions follow overall ASCVD risk, not age or any single lipid number.
Under this framework, adults aged 40 to 75 undergo 10-year ASCVD risk estimation using the Pooled Cohort Equations. A risk of 20 percent or higher places a person in the high-risk group. A risk between 7.5 and 20 percent leads to a clinician-patient discussion about statin therapy, weighing risk-enhancing factors such as family history of premature cardiovascular disease, elevated lipoprotein(a), and persistent triglycerides of 175 mg/dL or higher. A risk below 7.5 percent generally supports a lifestyle focus, with statin therapy considered in selected cases.1
Several groups receive specific attention regardless of the risk score. An LDL of 190 mg/dL or higher suggests possible familial hypercholesterolemia and prompts intensive evaluation at any age. Adults with diabetes aged 40 to 75 fall into a statin benefit group under the framework established by the 2013 guideline and retained in 2018.1,2
Readers who want to see where they fall on the risk scale can use the ASCVD risk calculator on this site, which applies the same Pooled Cohort Equations. The categories behind the score are explained in more detail in What Is a Good Heart Score?
What the guideline does not do is set different LDL or total cholesterol targets for each decade of life. No major guideline publishes an LDL goal for a 50-year-old or a total cholesterol goal for a 70-year-old. Age enters the framework through the risk estimator, where it is one of the strongest predictors. The lipid thresholds themselves — optimal LDL below 100, desirable total below 200, normal triglycerides below 150 — apply to adults of all ages. That is the consistent message across ATP III, the 2013 guideline, and the 2018 guideline: fixed thresholds, risk-based responses.1,2,3
🧮 Check Your ASCVD Risk
Calculate your 10-year ASCVD risk using the Pooled Cohort Equations and see which risk category you fall in.
Try the ASCVD Calculator →
Frequently Asked Questions
Does normal cholesterol change with age?
What is a good LDL cholesterol for a 50-year-old?
Is higher HDL always better?
When should cholesterol be checked?
Do borderline numbers mean medication is needed?
Sources
- Grundy SM, Stone NJ, Bailey AL, et al. 2018 AHA/ACC/AACVPR/AAPA/ABC/ACPM/ADA/AGS/APhA/ASPC/NLA/PCNA Guideline on the Management of Blood Cholesterol. Circulation. 2019;139(25):e1082-e1143. DOI: 10.1161/CIR.0000000000000625
- Stone NJ, Robinson JG, Lichtenstein AH, et al. 2013 ACC/AHA Guideline on the Treatment of Blood Cholesterol to Reduce Atherosclerotic Cardiovascular Risk in Adults. Circulation. 2014;129(25 Suppl 2):S1-S45. DOI: 10.1161/01.cir.0000437738.63853.7a
- National Cholesterol Education Program (NCEP) Expert Panel on Detection, Evaluation, and Treatment of High Blood Cholesterol in Adults. Third Report of the National Cholesterol Education Program (NCEP) Expert Panel on Detection, Evaluation, and Treatment of High Blood Cholesterol in Adults (Adult Treatment Panel III). NIH Publication No. 02-5215. National Heart, Lung, and Blood Institute; 2002. NHLBI: Blood Cholesterol
- Miller M, Stone NJ, Ballantyne C, et al. Triglycerides and Cardiovascular Disease: A Scientific Statement From the American Heart Association. Circulation. 2011;123(20):2292-2333. DOI: 10.1161/CIR.0b013e3182160726
- Ference BA, Ginsberg HN, Graham I, et al. Low-density lipoproteins cause atherosclerotic cardiovascular disease. 1. Evidence from genetic, epidemiologic, and clinical studies. A consensus statement from the European Atherosclerosis Society Consensus Panel. Eur Heart J. 2017;38(32):2459-2472. DOI: 10.1093/eurheartj/ehx144
- Emerging Risk Factors Collaboration; Di Angelantonio E, Sarwar N, Perry P, et al. Major lipids, apolipoproteins, and risk of vascular disease. JAMA. 2009;302(18):1993-2000. DOI: 10.1001/jama.2009.1619
- Wilson PWF, Abbott RD, Castelli WP. High density lipoprotein cholesterol and mortality: the Framingham Heart Study. Arteriosclerosis. 1988;8(6):737-741. DOI: 10.1161/01.ATV.8.6.737
- Virani SS, Alonso A, Aparicio HJ, et al. Heart Disease and Stroke Statistics—2021 Update: A Report From the American Heart Association. Circulation. 2021;143(8):e254-e743. DOI: 10.1161/CIR.0000000000000821
- Jacobson TA, Ito MK, Maki KC, et al. National Lipid Association recommendations for patient-centered management of dyslipidemia: part 1 — full report. J Clin Lipidol. 2015;9(1):129-169. DOI: 10.1016/j.jacl.2014.11.002
- Carroll MD, Fryar CD, Kit BK. Total and High-Density Lipoprotein Cholesterol in Adults: United States, 2011–2014. NCHS Data Brief No. 281. Hyattsville, MD: National Center for Health Statistics; 2017. NCHS Data Brief No. 281
- Carroll MD, Fryar CD, Nguyen DT. Total and High-Density Lipoprotein Cholesterol in Adults: United States, 2015–2018. NCHS Data Brief No. 363. Hyattsville, MD: National Center for Health Statistics; 2020. NCHS Data Brief No. 363
Editorial review: This article was reviewed by the Heart Score Calculator Editorial Team on October 18, 2026. The professional name "Dr. Heart" identifies this editorial work and does not replace advice, diagnosis or treatment from a licensed healthcare professional.