What Is a Good Heart Score?
A good heart score depends on which scoring system is used. For the ASCVD 10-year risk calculator, a score below 5% falls in the low-risk category. For the HEART Score used in chest pain evaluation, a score of 0 to 3 indicates low risk.
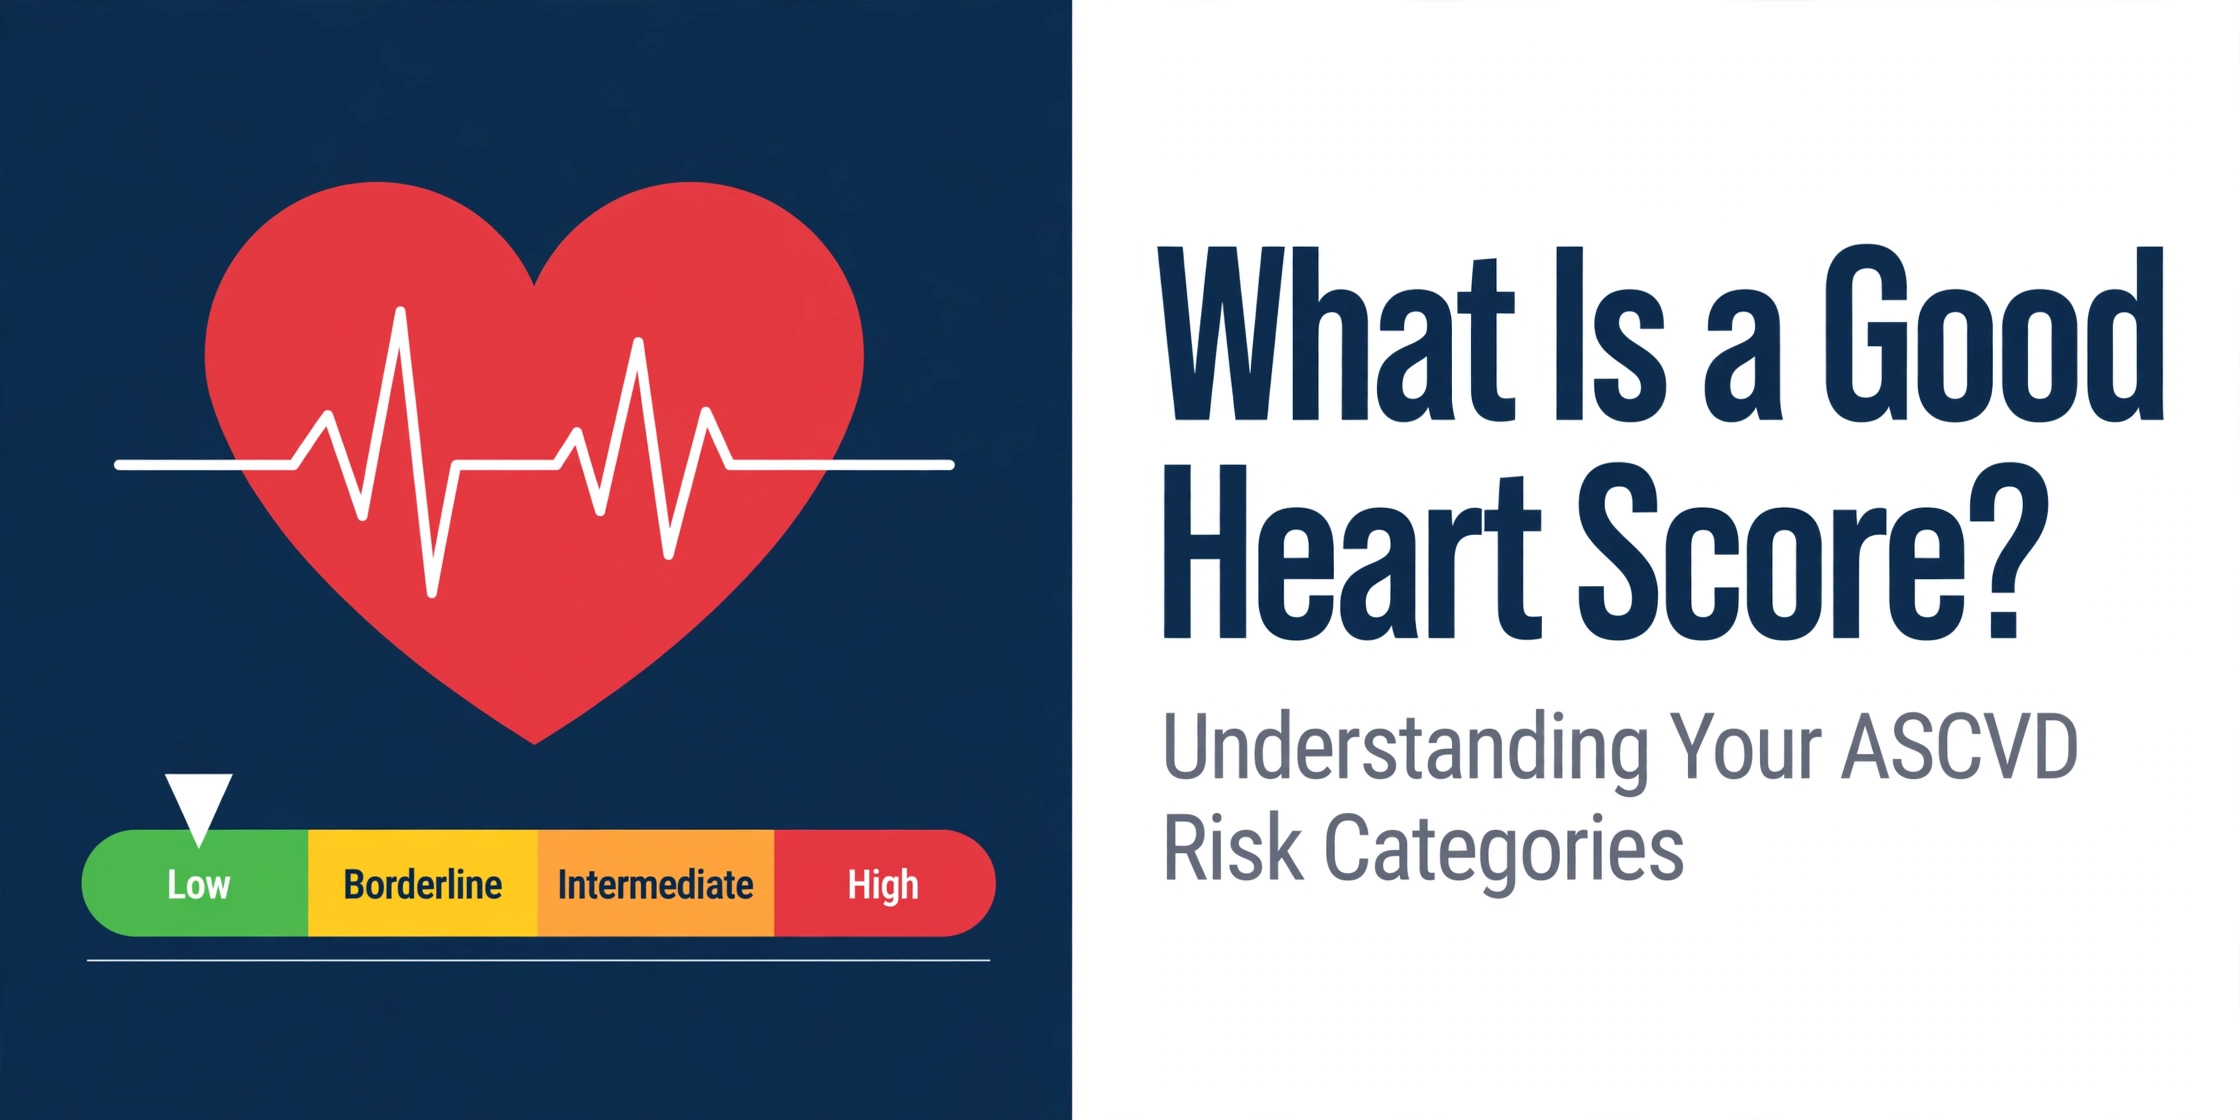
Heart score risk ranges vary by scoring system. The ASCVD calculator uses four categories from low (below 5%) to high (20% or above).
Key Takeaways
- ASCVD 10-year risk below 5% is low risk; 20% or higher is high risk.
- HEART Score of 0–3 indicates low risk for chest pain patients in the emergency department.
- Framingham Risk Score below 10% is low risk for coronary heart disease over 10 years.
- Age, blood pressure, cholesterol, smoking, and diabetes are the main factors that drive heart scores.
- Heart scores are population-based estimates, not individual predictions.
A heart score is a number that estimates the probability of a cardiovascular event over a defined period. Different scoring systems measure different outcomes and use different scales. The ASCVD calculator estimates 10-year risk of atherosclerotic cardiovascular disease. The HEART Score estimates short-term risk for patients presenting with chest pain. The Framingham Risk Score estimates 10-year risk of coronary heart disease.
Each system has its own definition of "good." A score that is low risk on one scale may not translate directly to another scale. Understanding the specific system behind a number matters more than the number alone. This article explains the main scoring systems, their ranges, and what each range reflects clinically.
What Is a Heart Score?
A heart score is a calculated estimate derived from clinical and demographic variables. Clinicians use these scores to stratify risk, guide discussions about prevention, and inform decisions about further testing. Risk scores do not detect disease directly. They estimate probability based on patterns observed in large population studies.
The most widely used heart scores in clinical practice include the ASCVD Pooled Cohort Equations (PCE), the HEART Score, and the Framingham Risk Score. Each was developed from a different study population and validated for a specific purpose. The ASCVD PCE estimates 10-year risk of heart attack, stroke, and cardiovascular death in adults aged 40 to 75 without known cardiovascular disease.1 The HEART Score evaluates patients presenting to the emergency department with chest pain.4 The Framingham Risk Score estimates 10-year risk of coronary heart disease.5
In 2023, the American Heart Association introduced the PREVENT™ equations as a newer model that incorporates additional variables including kidney function and social determinants of health.3 PREVENT represents an evolution in risk prediction, though the PCE remains widely used in current guidelines. Clinicians may use either model depending on the clinical context and available data.
Heart scores serve three main purposes in clinical practice. First, they provide a standardized way to communicate risk. Second, they help clinicians identify patients who may benefit from more intensive evaluation. Third, they create a baseline for tracking changes over time as risk factors shift. A score alone does not determine treatment. Clinicians evaluate scores alongside imaging, laboratory results, family history, and patient preferences.
ASCVD 10-Year Risk Categories
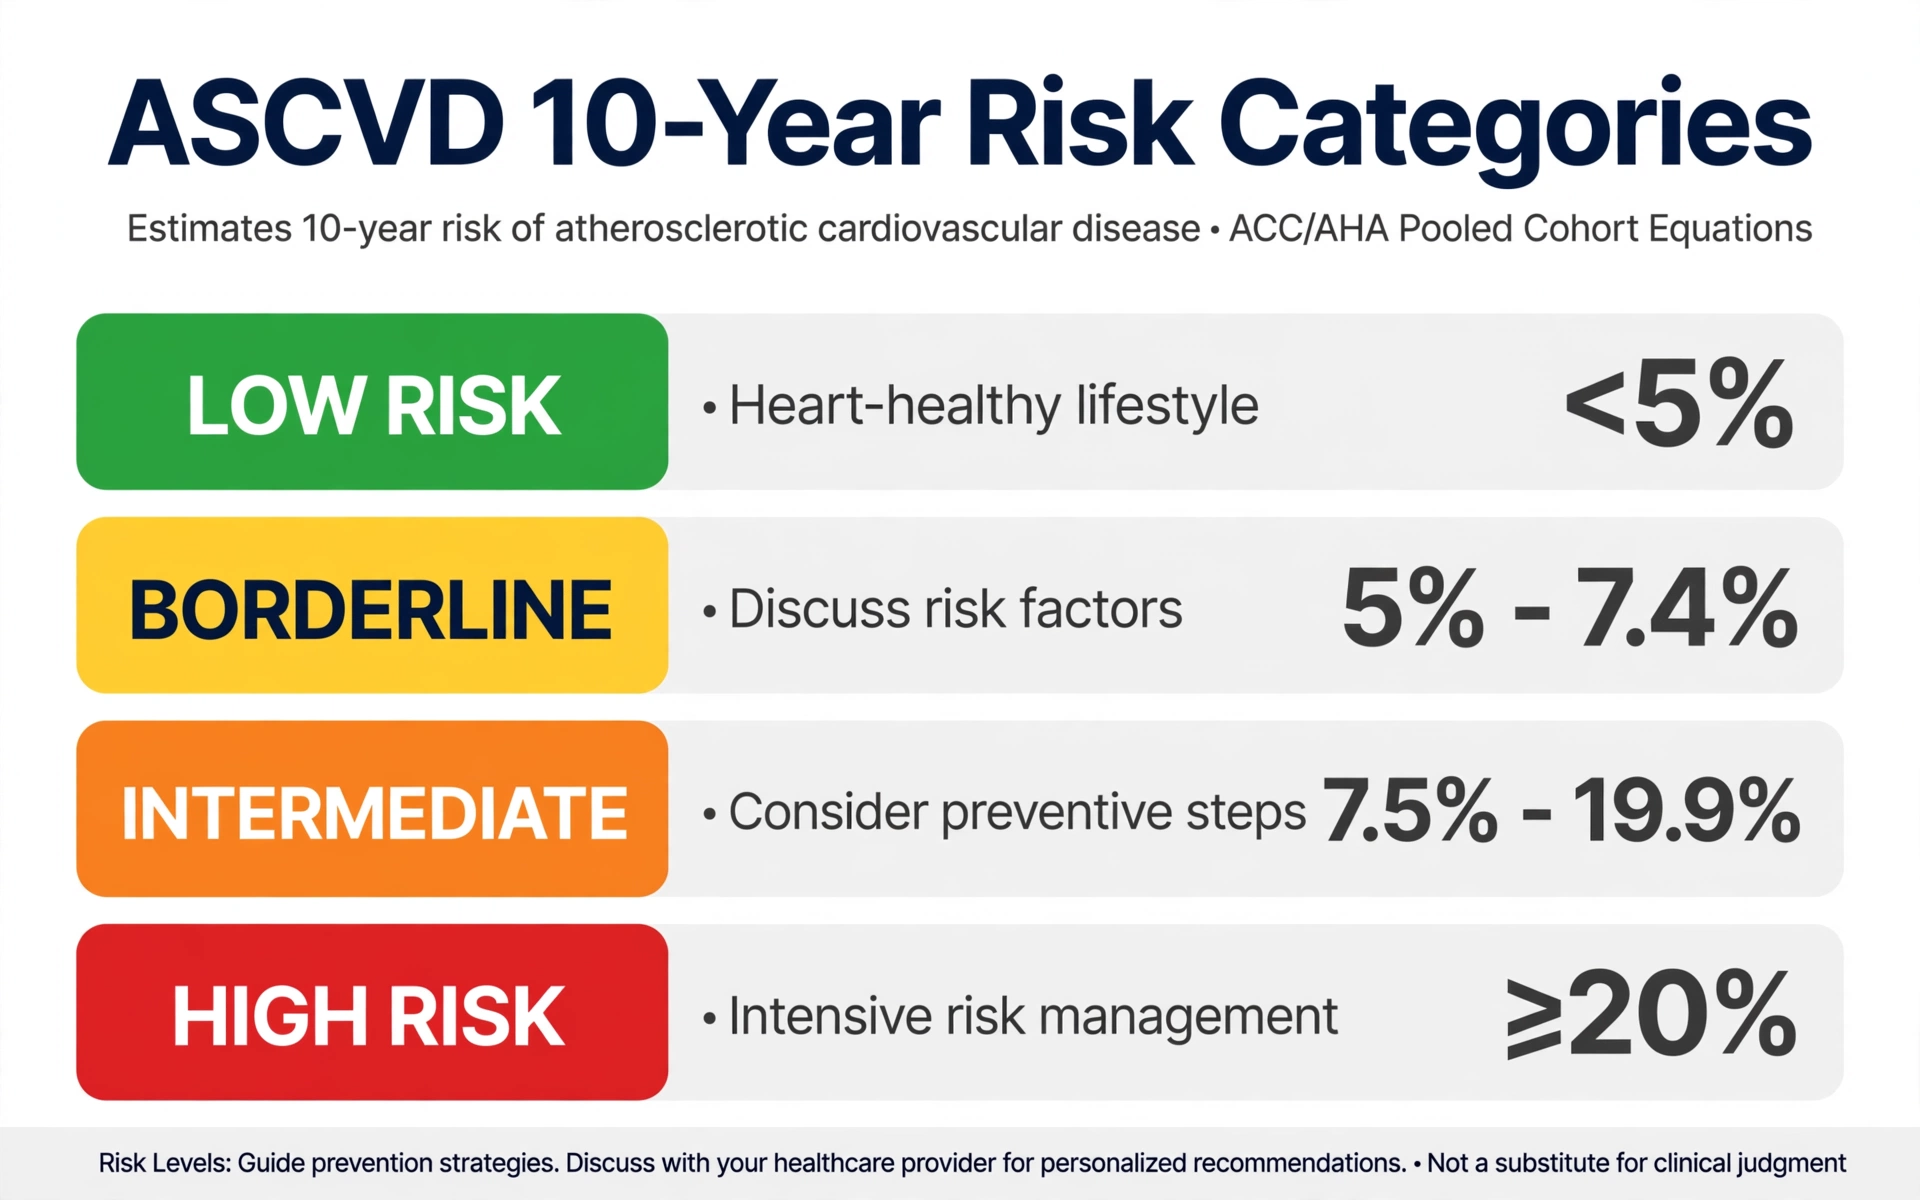
The ASCVD 10-year risk calculator uses the Pooled Cohort Equations to estimate the probability of a first atherosclerotic cardiovascular event within 10 years. The 2018 ACC/AHA cholesterol guideline defines four risk categories based on the calculated percentage.7
| ASCVD 10-Year Risk | Category | Clinical Meaning |
|---|---|---|
| Below 5% | Low Risk | Low estimated probability of ASCVD event in 10 years |
| 5% to 7.4% | Borderline Risk | Borderline probability; clinicians may consider additional risk factors |
| 7.5% to 19.9% | Intermediate Risk | Moderate probability; risk-enhancing factors often evaluated |
| 20% or Higher | High Risk | High estimated probability; intensive evaluation commonly discussed |
A score below 5% is considered low risk. This means that among 100 people with the same risk profile, fewer than 5 would be expected to experience an ASCVD event in the next 10 years. The estimate comes from population data, not from a direct measurement of an individual's arteries.
The borderline range (5% to 7.4%) represents a gray zone. Clinicians often evaluate additional risk-enhancing factors in this range, such as family history of premature cardiovascular disease, elevated lipoprotein(a), or coronary artery calcium scores.7 These additional factors can shift the clinical picture toward higher or lower concern.
Intermediate risk (7.5% to 19.9%) covers a wide range. A score of 8% and a score of 19% both fall in this category, yet they reflect different levels of estimated risk. Clinicians evaluate the specific number within the category, not just the category label. Coronary artery calcium scoring is sometimes used as a tiebreaker in this range, particularly for scores between 7.5% and 20% where the decision about preventive therapy is uncertain.7
High risk (20% or higher) indicates a substantial estimated probability. Clinicians often discuss intensive risk factor management in this category. The specific approach depends on the individual's full clinical picture, including blood pressure, cholesterol levels, diabetes status, and other conditions.
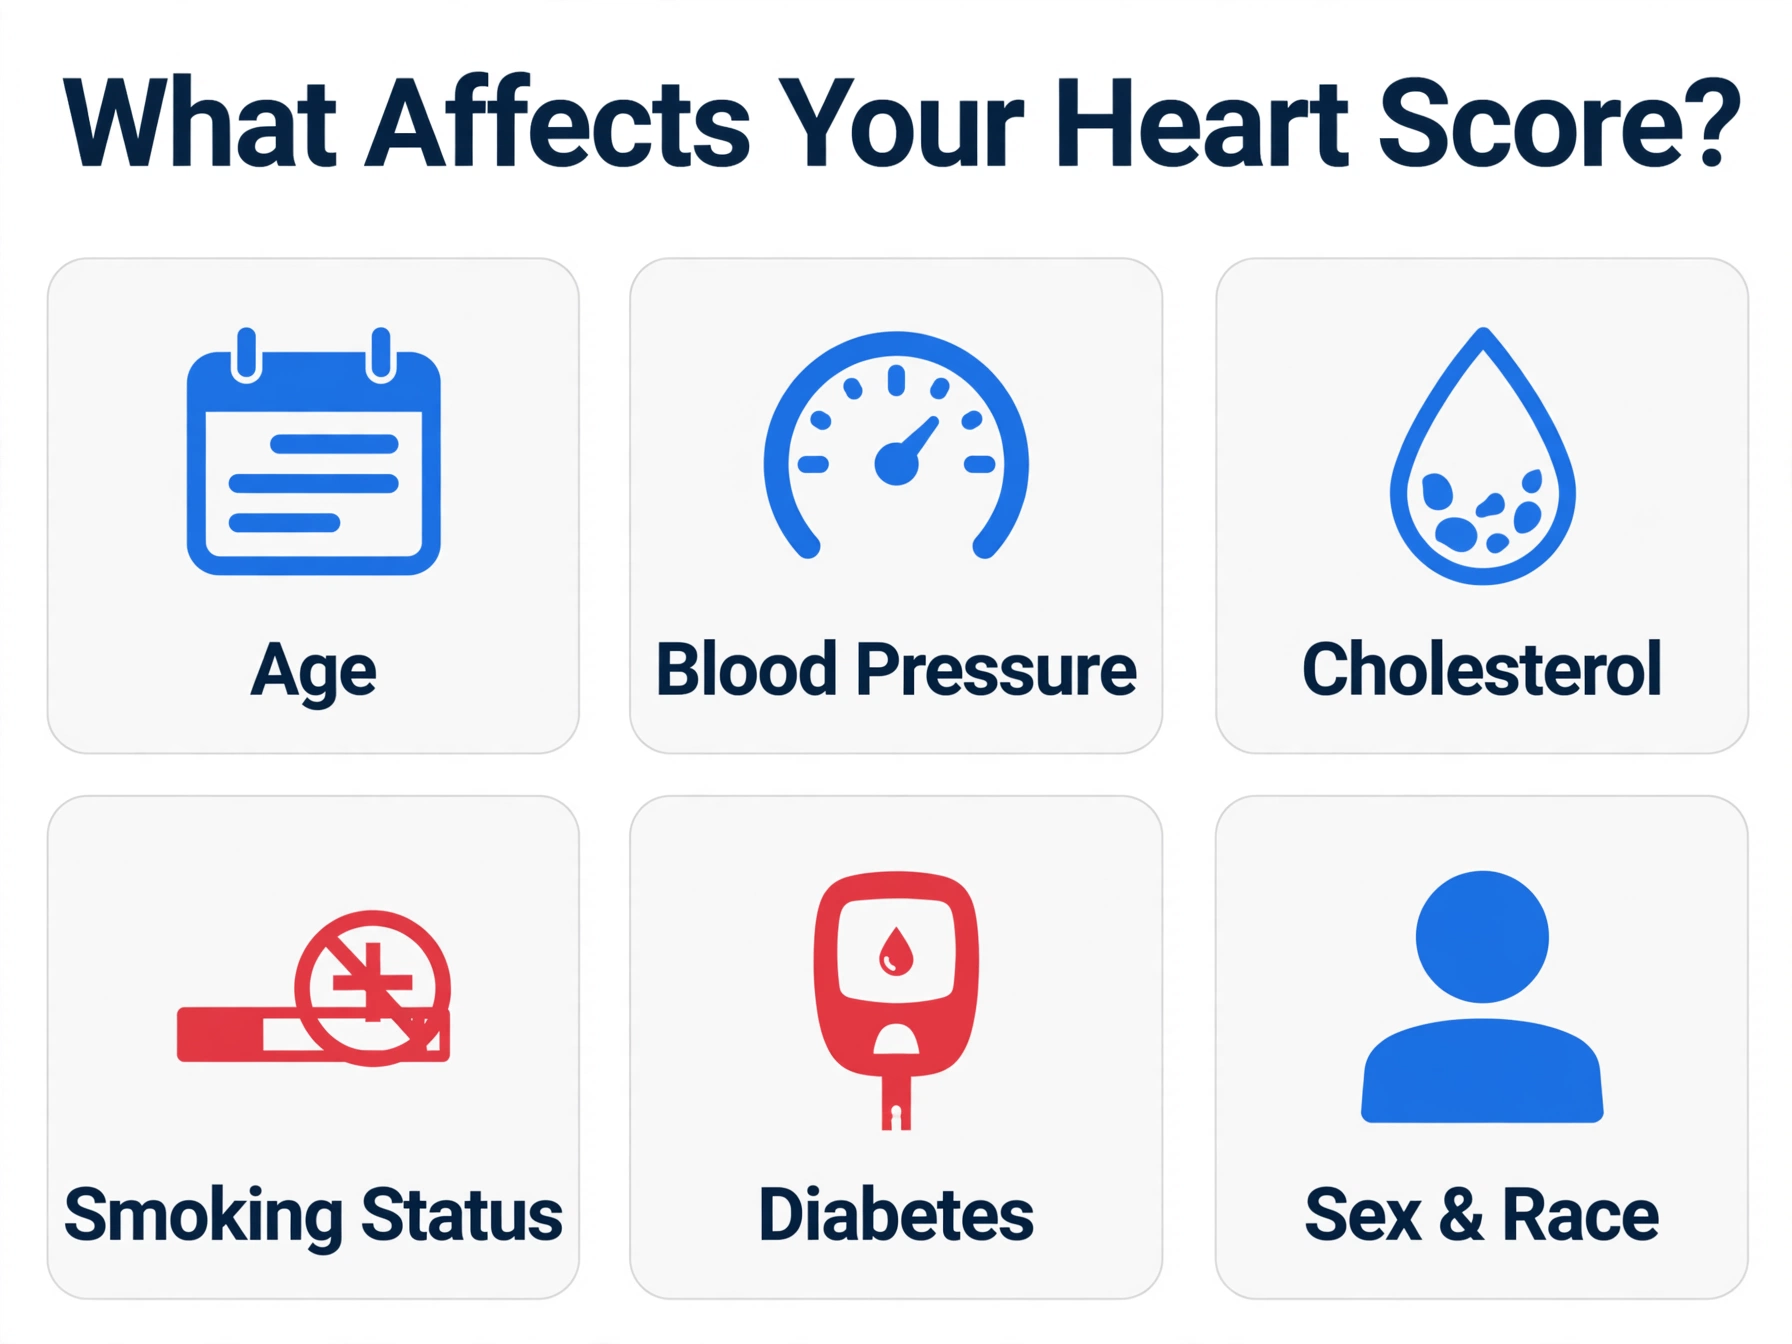
To calculate an ASCVD score, clinicians input age, sex, race, total cholesterol, HDL cholesterol, systolic blood pressure, blood pressure treatment status, diabetes status, and smoking status. The ASCVD risk calculator on this site uses the same Pooled Cohort Equations from the 2013 ACC/AHA guideline.1
HEART Score for Chest Pain
The HEART Score addresses a different clinical question than ASCVD risk. It evaluates patients who arrive at the emergency department with chest pain. The score estimates the risk of major adverse cardiac events (MACE) within 6 weeks, including heart attack, need for revascularization, and death.4
HEART stands for History, ECG, Age, Risk factors, and Troponin. Each component receives 0, 1, or 2 points, for a total score from 0 to 10. The score helps emergency clinicians stratify patients into low, moderate, or high risk groups.11
| HEART Score | Risk Category | Estimated MACE Risk |
|---|---|---|
| 0 to 3 | Low Risk | Approximately 0.9% to 1.7% MACE within 6 weeks |
| 4 to 6 | Moderate Risk | Approximately 12% to 16.6% MACE within 6 weeks |
| 7 to 10 | High Risk | Approximately 50% to 65% MACE within 6 weeks |
A HEART Score of 0 to 3 indicates low risk. In validation studies, patients in this range had MACE rates below 2%.11 This low rate has led to the HEART Score being used as part of clinical pathways for chest pain evaluation, though the score is one component of a broader assessment.
A score of 4 to 6 indicates moderate risk. Patients in this range typically receive further evaluation, which may include observation, serial troponin testing, or stress testing depending on the clinical setting. The specific approach varies by hospital protocol and patient presentation.
A score of 7 to 10 indicates high risk. Patients in this range had MACE rates above 50% in validation studies.11 Emergency clinicians typically pursue prompt evaluation and admission for patients with high HEART Scores.
The HEART Score differs from ASCVD risk in timeframe and population. ASCVD estimates 10-year risk in people without known disease. HEART estimates 6-week risk in people presenting with acute chest pain. The two scores answer different questions and are not interchangeable. The HEART Score calculator on this site follows the original Six et al. framework.4
Framingham Risk Score Categories
The Framingham Risk Score is one of the oldest cardiovascular risk models. It was developed from the Framingham Heart Study, a long-term cohort study that began in 1948. The score estimates 10-year risk of coronary heart disease using age, sex, total cholesterol, HDL cholesterol, systolic blood pressure, blood pressure treatment status, and smoking status.5
Framingham categories use a point-based system that translates to percentage risk. The categories are simpler than ASCVD but cover a similar range.
| Framingham 10-Year Risk | Category | Clinical Meaning |
|---|---|---|
| Below 10% | Low Risk | Low estimated probability of coronary heart disease in 10 years |
| 10% to 20% | Intermediate Risk | Moderate probability; further evaluation often discussed |
| Above 20% | High Risk | High estimated probability of coronary heart disease in 10 years |
A Framingham score below 10% is considered low risk. This threshold is higher than the ASCVD low-risk threshold (below 5%) because the two models measure different outcomes. Framingham focuses on coronary heart disease specifically, while ASCVD includes stroke and cardiovascular death in addition to coronary events.
The Framingham model has influenced many later risk calculators. The ASCVD PCE built on Framingham methodology but expanded the outcome to include stroke and used a more diverse study population. Clinicians may use either model depending on the clinical context and guideline recommendations.5
One limitation of the original Framingham score is that it was derived primarily from a White population in Massachusetts. The ASCVD PCE incorporated data from more diverse cohorts, including the Atherosclerosis Risk in Communities (ARIC) study, the Cardiovascular Health Study (CHS), and the Coronary Artery Risk Development in Young Adults (CARDIA) study.1 This broader population base improved generalizability, though no risk model captures all populations equally well.
The Framingham Risk Score calculator on this site uses the 2008 D'Agostino et al. general cardiovascular risk model, which expanded the original Framingham framework to include a broader set of cardiovascular outcomes.5
🧮 Check Your Heart Score
Calculate your 10-year ASCVD risk using the Pooled Cohort Equations.
Try the ASCVD Calculator →What Factors Affect Your Heart Score?
Heart scores are calculated from a set of input variables. Each variable contributes to the final risk estimate. Understanding these factors helps explain why scores differ between individuals and why scores change over time.
Age is the strongest single driver of most heart risk models. Risk increases with age because the cumulative exposure to other risk factors grows over decades. The Pooled Cohort Equations use age as a continuous variable, meaning each additional year increases the estimated risk. This is why a 65-year-old with normal cholesterol may have a higher score than a 45-year-old with elevated cholesterol.
Blood pressure contributes through systolic blood pressure and whether blood pressure medication is being used. The 2017 ACC/AHA hypertension guideline defines normal blood pressure as below 120/80 mm Hg, elevated as 120-129/<80, Stage 1 hypertension as 130-139/80-89, and Stage 2 as 140/90 or higher.8 Higher systolic blood pressure increases estimated risk in the PCE model. Blood pressure treatment status is also an input — being on medication indicates a history of elevated blood pressure.
Cholesterol enters the model through total cholesterol and HDL cholesterol. Total cholesterol reflects the sum of all cholesterol in the blood, including LDL, HDL, and VLDL. HDL cholesterol is often called "good" cholesterol because higher levels are associated with lower cardiovascular risk. The PCE uses the ratio between these values, not just the absolute numbers. The 2018 cholesterol guideline emphasizes LDL cholesterol as a primary target for risk reduction.7
Smoking status is a binary input in most models: current smoker or not. Smoking increases cardiovascular risk through multiple mechanisms, including endothelial damage, inflammation, and increased clotting tendency. The PCE does not distinguish between light and heavy smoking. Former smokers are classified as non-smokers in the PCE, though the duration since quitting can affect residual risk.
Diabetes status is another binary input. Diabetes substantially increases cardiovascular risk. The PCE treats diabetes as present or absent. It does not account for diabetes duration, glycemic control (HbA1c level), or diabetes type. These nuances mean the model may underestimate risk in patients with long-standing or poorly controlled diabetes.
Sex and race are demographic inputs in the PCE. The model uses separate equations for men and women, and for Black and White populations. These stratifications reflect observed differences in cardiovascular risk patterns across groups in the derivation cohorts. The PREVENT equations expanded race categories and added a social deprivation index to address some of these limitations.3
10-Year Risk vs. Lifetime Risk
Most heart scores estimate 10-year risk. This timeframe aligns with clinical decision-making about preventive therapy. However, 10-year risk can understate the importance of risk factors in younger adults. A 35-year-old with elevated cholesterol may have low 10-year risk simply because cardiovascular events are uncommon at that age. The same person's lifetime risk may be substantially higher.
Lifetime risk estimates the cumulative probability of a cardiovascular event through age 80 or beyond. The concept gained attention from a 2006 study by Lloyd-Jones et al., which showed that lifetime risk for cardiovascular disease exceeds 50% for men and 40% for women at age 50, even among those with optimal risk factor profiles.6 This finding illustrates that low short-term risk does not mean low lifetime risk.
Clinicians may discuss both timeframes. The 10-year risk guides near-term decisions about preventive therapy. Lifetime risk provides context for long-term lifestyle discussions and motivates earlier intervention. A young adult with low 10-year risk but high lifetime risk may benefit from earlier attention to diet, exercise, and smoking cessation, even if medication is not indicated.
The PREVENT equations include both 10-year and 30-year risk estimates, reflecting a shift toward longer-term risk communication.3 This dual timeframe helps clinicians discuss risk with younger patients who may have low 10-year risk but elevated long-term risk. The 30-year estimate provides a middle ground between the traditional 10-year window and full lifetime risk.
When interpreting a heart score, the timeframe matters as much as the number. A 5% 10-year risk and a 5% lifetime risk convey very different information. Always note which timeframe a score represents before drawing conclusions.
How Heart Scores Are Calculated
Heart scores use statistical models derived from large cohort studies. Researchers follow thousands of participants over decades, recording risk factors and cardiovascular outcomes. Statistical analysis identifies which factors predict events and how strongly each factor contributes. The resulting equations translate a set of input values into a probability estimate.
The Pooled Cohort Equations (PCE) were derived from five cohort studies: ARIC, CARDIA, CHS, Framingham Original, and Framingham Offspring.1 The equations use Cox proportional hazards regression, a statistical method that estimates the relationship between risk factors and time to event. The model produces a 10-year risk estimate by combining the individual's risk factor values with baseline survival rates from the derivation cohorts.
The PREVENT equations, published in 2023, used data from over 6 million adults across 25 datasets.3 PREVENT expanded the PCE in several ways. It includes estimated glomerular filtration rate (eGFR) as a marker of kidney function, which is an independent cardiovascular risk factor. It incorporates a social deprivation index based on ZIP code. It estimates both 10-year and 30-year risk. It also estimates risk for heart failure in addition to atherosclerotic events.
Both PCE and PREVENT require the same core inputs: age, sex, blood pressure, cholesterol, smoking status, and diabetes status. PREVENT adds eGFR and optionally includes HbA1c and urine albumin-to-creatinine ratio for patients with diabetes. The additional variables improve risk estimation, particularly for patients with kidney disease or diabetes.
The HEART Score uses a simpler approach. Each of five components (History, ECG, Age, Risk factors, Troponin) receives 0, 1, or 2 points based on predefined criteria. The points are summed to produce a total score from 0 to 10. This additive model is easier to calculate at the bedside than the regression-based PCE or PREVENT models.4
All heart score models share a common structure: inputs go in, a formula processes them, and a probability or point total comes out. The models differ in which inputs they use, how they weight each input, and what outcome they predict. Understanding these differences helps explain why the same person can receive different scores from different calculators.
Limitations of Heart Scores
Heart scores are population-based estimates, not individual predictions. A 10% 10-year risk means that among 100 people with the same risk profile, approximately 10 would be expected to experience an event in 10 years. The model cannot identify which 10 people will have events. An individual with a 10% score may or may not experience an event. The score describes group probability, not personal fate.
Risk models do not capture all relevant factors. The PCE does not include family history of premature cardiovascular disease, lipoprotein(a) levels, coronary artery calcium, inflammatory markers, or specific dietary patterns. These factors can substantially affect individual risk. A person with a strong family history and elevated Lp(a) may have higher actual risk than the PCE estimate suggests. Clinicians evaluate these risk-enhancing factors alongside the calculated score.7
Risk models are calibrated to specific populations. The PCE was derived primarily from Black and White adults aged 40 to 79. Its accuracy may vary for other racial and ethnic groups, for adults outside the 40-79 age range, and for populations with different baseline risk. The PREVENT equations expanded the derivation population but still have limitations for certain subgroups.3
Scores assume that risk factors remain stable over the prediction period. In reality, blood pressure, cholesterol, smoking status, and diabetes status can change. A score calculated today reflects current values. If those values change, the score changes. This is why clinicians recalculate scores periodically rather than treating a single score as permanent.
Heart scores do not detect existing disease. A low score does not rule out subclinical atherosclerosis. Coronary artery calcium scoring can reveal plaque in people with low or intermediate ASCVD risk. The 2018 cholesterol guideline suggests considering CAC scoring for patients in the intermediate risk range where the decision about statin therapy is uncertain.7 Imaging and risk scores provide complementary information, not redundant information.
Finally, risk scores are tools for discussion, not decision-makers. Clinicians use scores as one input among many when evaluating cardiovascular risk. Patient preferences, comorbidities, life expectancy, and treatment burden all factor into clinical decisions. A score provides a starting point for conversation, not a final answer.
🧮 Check Your Emergency HEART Score
Evaluate acute chest pain risk in clinical settings using History, ECG, Age, Risk factors, and Troponin.
Try the HEART Score Calculator →
Frequently Asked Questions
What is considered a good ASCVD heart score?
What is a good HEART Score for chest pain?
Can my heart score change over time?
What is the difference between 10-year and lifetime heart risk?
Does a low heart score mean I have no heart disease?
How often should heart scores be recalculated?
Clinical Sources & Citations
- Goff DC Jr, Lloyd-Jones DM, Bennett G, et al. 2013 ACC/AHA Guideline on the Assessment of Cardiovascular Risk. Circulation. 2014;129(25 Suppl 2):S49-S73. DOI: 10.1161/01.cir.0000437741.48606.98
- Arnett DK, Blumenthal RS, Albert MA, et al. 2019 ACC/AHA Guideline on the Primary Prevention of Cardiovascular Disease. Circulation. 2019;140(11):e596-e646. DOI: 10.1161/CIR.0000000000000678
- Khan SS, Coresh J, Pencina MJ, et al. Novel Prediction Equations for Absolute Risk Assessment of Total Cardiovascular Disease Incorporating Cardiovascular-Kidney-Metabolic Health. Circulation. 2023. DOI: 10.1161/CIRCULATIONAHA.123.067626
- Six AJ, Backus BE, Kelder JC. Chest pain in the emergency room: value of the HEART score. Neth Heart J. 2008;16(6):191-196. DOI: 10.1007/BF03086144
- D'Agostino RB Sr, Vasan RS, Pencina MJ, et al. General Cardiovascular Risk Profile for Use in Primary Care. Circulation. 2008;117(6):743-753. DOI: 10.1161/CIRCULATIONAHA.107.699579
- Lloyd-Jones DM, Leip EP, Larson MG, et al. Prediction of Lifetime Risk for Cardiovascular Disease by Risk Factor Burden at 50 Years of Age. Circulation. 2006;113(6):791-798. DOI: 10.1161/CIRCULATIONAHA.105.548206
- Grundy SM, Stone NJ, Bailey AL, et al. 2018 AHA/ACC/Multisociety Cholesterol Guideline. Circulation. 2019;139(25):e1082-e1143. DOI: 10.1161/CIR.0000000000000625
- Whelton PK, Carey RM, Aronow WS, et al. 2017 ACC/AHA/AAPA/ABC/ACPM/AGS/APhA/ASH/ASPC/NMA/PCNA Guideline for the Prevention, Detection, Evaluation, and Management of High Blood Pressure in Adults. Hypertension. 2018;71(6):e13-e115. DOI: 10.1161/HYP.0000000000000065
- Wilson PWF, D'Agostino RB, Levy D, et al. Prediction of Coronary Heart Disease Using Risk Factor Categories. Circulation. 1998;97(18):1837-1847. DOI: 10.1161/01.CIR.97.18.1837
- Pencina MJ, Navar AM, Wojdyla D, et al. Quantifying Importance of Major Risk Factors for Coronary Heart Disease. Circulation. 2019;139(13):1603-1611. DOI: 10.1161/CIRCULATIONAHA.117.031855
- Backus BE, Six AJ, Kelder JC, et al. A Prospective Validation of the HEART Score for Chest Pain Patients at the Emergency Department. Int J Cardiol. 2013;168(3):2153-2158. DOI: 10.1016/j.ijcard.2013.01.255
- Stone NJ, Robinson JG, Lichtenstein AH, et al. 2013 ACC/AHA Guideline on the Treatment of Blood Cholesterol to Reduce Atherosclerotic Cardiovascular Risk in Adults. Circulation. 2014;129(25 Suppl 2):S1-S45. DOI: 10.1161/01.cir.0000437738.63853.7a
Editorial review: This article was reviewed by the Heart Score Calculator Editorial Team on October 18, 2026. The professional name "Dr. Heart" identifies this editorial work and does not replace advice, diagnosis or treatment from a licensed healthcare professional.