What Is the AHA PREVENT™ Risk Calculator?
The AHA PREVENT calculator (Predicting Risk of cardiovascular disease EVENTs) represents the most significant update to primary cardiovascular risk estimation in more than a decade. Released in late 2023 and early 2024 by the American Heart Association (AHA) and published across flagship consensus statements in Circulation, the PREVENT tool was formulated to replace the legacy 2013 ACC/AHA Pooled Cohort Equations (PCE) for routine 10-year risk assessment.
Cardiovascular medicine has evolved rapidly over the past thirty years. When the original 2013 PCE was derived, it relied heavily on historic cohorts (such as the Framingham Heart Study cohorts, ARIC, and CHS) enrolled between the 1960s and 1990s. During that era, baseline population smoking rates were significantly higher, dietary patterns differed, and preventative therapies like statins and renin-angiotensin inhibitors were underutilized. Consequently, modern validation studies demonstrated that the older PCE systematically overestimated atherosclerotic cardiovascular disease (ASCVD) risk by 20% to 40% in contemporary populations, leading to widespread overtreatment and unnecessary statin prescriptions. Clinicians exploring modern preventative algorithms across our cardiovascular clinical calculators directory will find PREVENT represents the latest paradigm shift.
The prevent aha risk calculator resolves these calibration errors by drawing upon contemporary electronic health records and observational cohorts representing more than 6 million racially, ethnically, and socioeconomically diverse US adults. Whether accessed as the official prevent risk calculator aha or through clinical decision support systems utilizing the aha risk calculator prevent framework, this next-generation instrument—widely recognized among medical practitioners as prevent ahas new risk calculator—fundamentally expands cardiovascular prevention. By integrating the multi-organ axis of the Cardiovascular-Kidney-Metabolic (CKM) syndrome, PREVENT ensures that renal impairment and cardiometabolic dysfunction are recognized decades before an acute clinical event occurs.
Mathematical Architecture: How the PREVENT Equation Calculates Risk
The mathematical engine of the aha prevent risk calculator 2023 is founded upon sex-specific Cox proportional hazards models and parametric log-odds regression equations. Rather than applying a single universal risk formula, PREVENT recognizes that biological sex alters the fundamental baseline hazard and interaction dynamics of lipid subfractions, arterial stiffness, and glycemic load.
Risk prediction in PREVENT operates through a multi-step centered logarithmic transformation. Key continuous predictors are centered around biological reference medians (Age centered at 55 years, SBP centered at 130 mmHg, non-HDL cholesterol centered at 3.5 mmol/L, HDL cholesterol centered at 1.3 mmol/L, and eGFR centered at 90 mL/min/1.73m²). To model non-linear biological thresholds accurately, the 2023 aha prevent calculator incorporates piece-wise linear splines:
- Systolic Blood Pressure (SBP) Spline: Segmented into sub-threshold values (< 110 mmHg) and elevated pressures (≥ 110 mmHg), recognizing that vascular risk increases linearly only once systolic pressure exceeds 110–120 mmHg. In hypertensive patients, tracking both SBP and Mean Arterial Pressure (MAP) provides a comprehensive view of hemodynamic load.
- Body Mass Index (BMI) Spline: Splined at 30 kg/m² to reflect differing metabolic risks between overweight non-obese individuals and class I–III obesity. For clinical evaluations, combining standard Body Mass Index (BMI) with the Waist-to-Hip Ratio Calculator identifies central visceral adiposity more precisely than weight alone.
- Renal Function (eGFR) Spline: Splined at the clinical threshold of chronic kidney disease (60 mL/min/1.73m²), capturing the exponential acceleration of vascular calcification and heart failure risk as glomerular filtration drops below Stage 3 CKD. Clinicians can determine this directly using our race-free eGFR Calculator (CKD-EPI 2021).
For any patient profile, the linear predictor (log-odds $\gamma$) is computed as the sum of centered terms multiplied by their corresponding $\beta$-coefficients plus a sex-specific intercept constant $\beta_0$. The cumulative event probability over horizon $t$ (10 or 30 years) is then determined by the logistic cumulative incidence function:
Visual Architecture: The Cardiovascular-Kidney-Metabolic (CKM) Triad
A core breakthrough of prevent aha's new risk calculator is its visual and mechanistic alignment with the CKM syndrome. Cardiovascular disease does not develop in isolation; rather, metabolic dysfunction (insulin resistance, central adiposity) drives microvascular renal disease, which subsequently damages myocardial compliance and accelerates large-vessel atherogenesis.
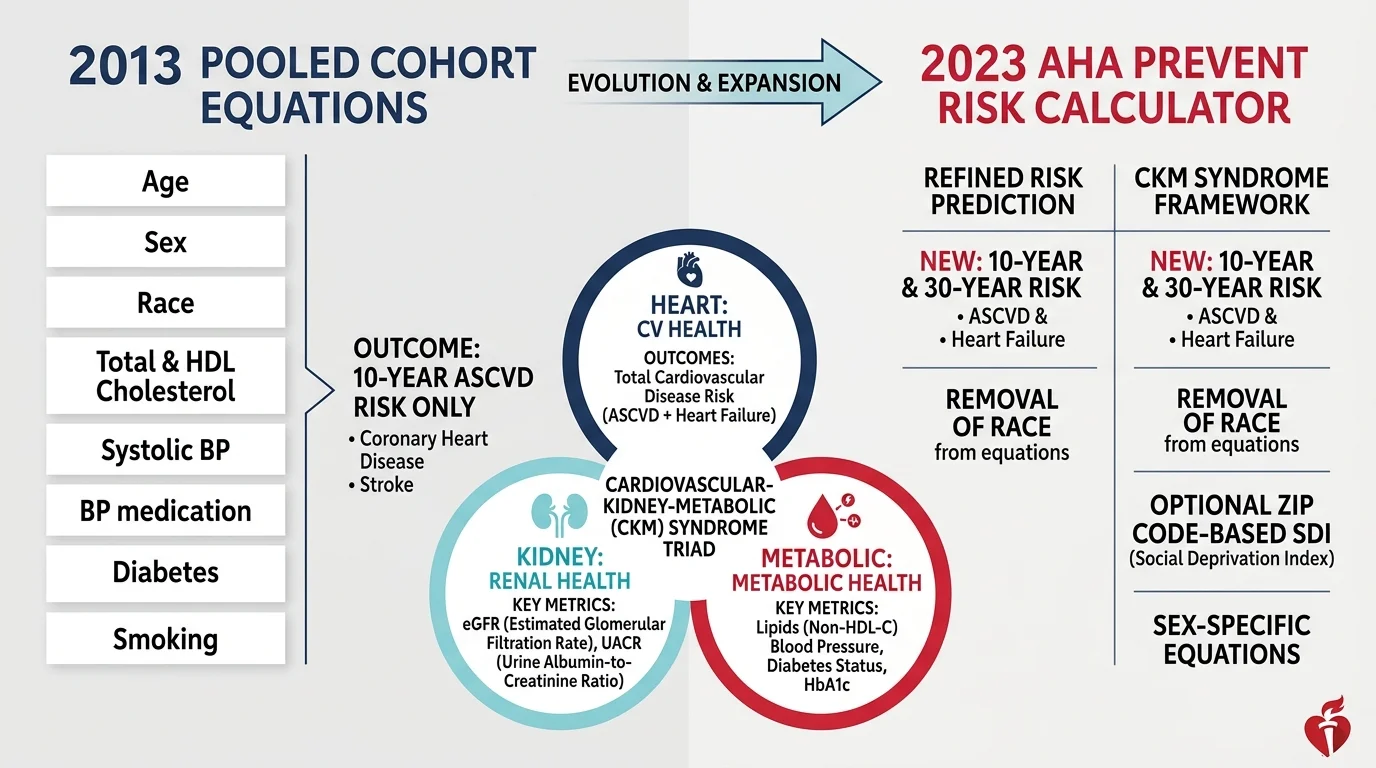
As demonstrated in the clinical diagram above, the PREVENT engine continuously cross-talks between three organ axes:
- Metabolic Axis: Central adiposity, elevated fasting glucose, diabetes mellitus, and atherogenic dyslipidemia trigger systemic low-grade endothelial inflammation and oxidative stress. Evaluating total caloric balance with the TDEE calculator and measuring body fat percentage aids patients in reversing early metabolic syndrome.
- Renal Axis: Glomerular hyperfiltration followed by progressive nephron loss (eGFR < 60 mL/min/1.73m²) and podocyte injury (uACR ≥ 30 mg/g) leads to systemic volume expansion, renin-angiotensin-aldosterone system (RAAS) overactivation, and uremic toxin retention. For comprehensive nephrology workups, evaluating renal clearance via Creatinine Clearance (Cockcroft-Gault) alongside the FENA calculator provides vital diagnostic separation.
- Cardiovascular Axis: Endothelial injury promotes plaque accumulation (coronary artery disease, carotid stenosis, ischemic stroke), while increased afterload and myocardial fibrosis culminate in heart failure with preserved (HFpEF) or reduced ejection fraction (HFrEF), with altered hemodynamics quantified by cardiac output and stroke volume estimation.
Clinical Input Variables & Reference Parameters
The aha prevent equation calculator evaluates eleven core clinical parameters in its standard model, with two optional high-precision laboratory biomarkers in the enhanced model. The complete variable specification is detailed below:
| Clinical Variable | Measurement Standard | Valid Input Range | Pathophysiological Relevance in PREVENT |
|---|---|---|---|
| Age | Completed chronological years | 30 to 79 Years | Dominant non-modifiable predictor of vascular exposure; used for both 10-year and 30-year risk projections. |
| Biological Sex | Female or Male | Binary | Determines baseline hazard intercept and sex-specific hazard ratios (e.g. differential diabetes impact in women). |
| Systolic Blood Pressure | Resting seated SBP (mmHg) | 90 to 200 mmHg | Primary hemodynamic driver of wall shear stress, arterial remodeling, and left ventricular hypertrophy. |
| Antihypertensive Therapy | Active pharmacological treatment | Yes / No (Binary) | Acts as an indicator of treated hypertension; interacts with SBP to prevent underestimating pre-treatment baseline risk. |
| Total & HDL Cholesterol | Fasting or non-fasting lipid profile | TC: 130–320 mg/dL HDL: 20–100 mg/dL |
Derives non-HDL cholesterol (TC minus HDL), quantifying circulating ApoB particles. For atherogenic fraction breakdown, see our LDL Cholesterol Calculator (Friedewald & Sampson). |
| Statin Lipid Therapy | Active HMG-CoA reductase inhibitor | Yes / No (Binary) | Adjusts observed non-HDL-C levels for therapeutic lipid lowering, preventing false underestimation of intrinsic plaque risk. |
| Diabetes Mellitus | Type 1 or Type 2 diagnosis | Yes / No (Binary) | Accelerates micro- and macro-vascular atherogenesis; carries high predictive weighting for incident heart failure. |
| Cigarette Smoking | Current active tobacco use | Yes / No (Last 30 Days) | Induces endothelial dysfunction, platelet hyperaggregability, and oxidative modification of low-density lipoproteins. |
| Body Mass Index (BMI) | Weight (kg) / Height (m²) | 18.5 to 50.0 kg/m² | Key cardiometabolic indicator; splined at 30 kg/m² to identify metabolic syndrome. Calculate via our BMI Calculator. |
| Estimated GFR (eGFR) | CKD-EPI 2021 race-free equation | 15 to 140 mL/min/1.73m² | Direct measure of renal clearance; splined at 60 mL/min. Calculate using our eGFR Calculator or review BUN/Creatinine Ratio. |
| Urine ACR (Optional) | Spot urine albumin-to-creatinine | 0.1 to 25,000 mg/g | Enhanced marker of systemic endothelial glycocalyx breakdown and subclinical renal microvascular damage. |
| HbA1c (Optional) | Glycated hemoglobin (%) | 4.5% to 15.0% | Enhanced metric of long-term glycemic control; provides granular risk separation in patients with or without diagnosed diabetes. |
AHA PREVENT Risk Stratification & Clinical Management Pathways
In alignment with the 2024 AHA/ACC Scientific Consensus on Cardiovascular-Kidney-Metabolic Health, the aha prevent online calculator categorizes 10-year Total CVD risk into four distinct prognostic tiers. Each tier corresponds to specific evidence-based lifestyle and pharmacological interventions:
Clinical Focus: Primary lifestyle preservation. Re-emphasize adherence to the AHA's "Life's Essential 8" (optimal diet, physical activity, non-smoking, healthy sleep, BMI < 25, normal lipids, normoglycemia, and blood pressure < 120/80 mmHg).
Pharmacotherapy: Statins generally not indicated unless LDL-C ≥ 190 mg/dL. Re-screen with PREVENT every 3 to 5 years.
Clinical Focus: Shared clinical decision-making. Assess for risk-enhancing factors: family history of premature ASCVD (<55 men, <65 women), persistent hypertriglyceridemia (≥ 175 mg/dL), metabolic syndrome, or chronic inflammatory conditions. In acute clinical presentations with atypical symptoms, emergency evaluation relies on the HEART Score for Chest Pain.
Pharmacotherapy: Moderate-intensity statin therapy favored if risk enhancers are present. Coronary Artery Calcium (CAC) scoring can be considered to reclassify indeterminate patients.
Clinical Focus: Active risk reduction. Initiate moderate-to-high intensity statin therapy targeting a ≥ 30% to ≥ 50% reduction in LDL-C (and LDL-C < 70 mg/dL), tracked using serial LDL cholesterol calculations.
Cardiorenal Interventions: In patients with concomitant type 2 diabetes or eGFR < 60 mL/min/1.73m², prioritize SGLT2 inhibitors and/or GLP-1 receptor agonists with proven cardiorenal benefit.
Clinical Focus: Aggressive multi-target intervention. High-intensity statin therapy (Atorvastatin 40–80 mg or Rosuvastatin 20–40 mg) targeting LDL-C < 55–70 mg/dL. Add Ezetimibe if targets are not achieved.
Blood Pressure & Diabetes: Target blood pressure < 130/80 mmHg using ACEi/ARB or CCB combinations. Optimize glycemic control with SGLT2 inhibitors and GLP-1 RAs.
PREVENT vs. 2013 Pooled Cohort Equations (PCE): The 6 Critical Paradigm Shifts
Why did the American Heart Association replace the Pooled Cohort Equations? The development of the prevent calculator aha resolves six critical scientific and clinical deficiencies of the original 2013 Pooled Cohort Equations:
Complete Removal of Race as a Biological Variable
The 2013 PCE used separate regression models for "White" and "African American" individuals. Decades of biomedical research have proven that race is a sociopolitical construct, not a valid biological category. Using race in algorithms risks reinforcing race-based medicine, normalizing health disparities, and masking genuine social determinants of health. PREVENT is completely race-free, relying instead on objective pathophysiological measures such as eGFR, blood pressure, and lipid subfractions.
Screening Initiated at Age 30 (Lowered from Age 40)
The older PCE excluded adults under age 40, creating a significant blind spot during critical decades when subclinical atherosclerosis and insulin resistance first take root. PREVENT lowers the starting age to 30, empowering clinicians to detect early cardiometabolic disease and intervene decades before irreversible vascular remodeling occurs.
Inclusion of Heart Failure as a Primary Predicted Outcome
The legacy PCE solely evaluated "hard ASCVD" (nonfatal myocardial infarction, coronary death, and stroke). However, in contemporary populations—particularly among individuals with diabetes, obesity, and hypertension—heart failure (both HFpEF and HFrEF) is often the first and most debilitating manifestation of cardiovascular disease. PREVENT estimates Total CVD, ASCVD, and Heart Failure independently. In patients with concurrent atrial arrhythmias, stroke prevention and anticoagulation bleeding risks are independently calculated using the CHA₂DS₂-VASc score and the HAS-BLED bleeding risk calculator.
Direct Integration of Kidney Function (eGFR & uACR)
Impaired renal clearance is one of the strongest independent risk multipliers for sudden cardiac death, accelerated arterial calcification, and heart failure hospitalization. Despite this, the 2013 PCE omitted renal biomarkers entirely. PREVENT incorporates eGFR natively and allows clinicians to enter urine albumin-to-creatinine ratio (uACR) to refine prognosis, which pairs directly with our eGFR calculator and Creatinine Clearance Cockcroft-Gault tool.
30-Year Lifetime Risk Estimation for Young Adults
In individuals aged 30 to 59, 10-year absolute risk is frequently low simply because age is the heaviest mathematical driver in decadal models. A 38-year-old with severe hypertension, smoking, and dyslipidemia might exhibit a 10-year risk of only 3.8% (falsely reassuring), while their 30-year lifetime risk exceeds 45%. Similar to the concept of vascular heart age in the Framingham Risk Score Calculator, PREVENT calculates dual 10-year and 30-year risk horizons, allowing clinicians to illustrate cumulative lifetime danger to young patients.
Recalibration to Contemporary US Populations (Ending Overtreatment)
Because baseline cardiovascular mortality in the United States has dropped significantly since the 1970s due to improved public health and emergency interventions, the 2013 PCE overestimated actual 10-year event rates by 20% to 40%. PREVENT was derived from over 6 million patients in modern health systems, yielding well-calibrated, realistic risk estimates that safely reduce unnecessary overmedication.
Cardiovascular-Kidney-Metabolic (CKM) Syndrome Staging Matrix
The American Heart Association defined CKM syndrome as a clinical disorder attributable to the complex interactions among metabolic risk factors, chronic kidney disease, and the cardiovascular system. PREVENT serves as the quantitative assessment instrument across the five CKM stages:
| CKM Stage | Clinical Phenotype | Diagnostic Criteria | Role of PREVENT Calculator |
|---|---|---|---|
| Stage 0 | No CKM Risk Factors | Normal BMI, normoglycemia, normal BP, normal lipids, eGFR ≥ 90, uACR < 30 mg/g. | PREVENT risk is consistently < 5.0%. Reinforce primary lifestyle preservation. |
| Stage 1 | Excess Adiposity / Impaired Glycemia | BMI ≥ 25 kg/m² (or waist ≥ 88 cm women, ≥ 102 cm men), prediabetes (HbA1c 5.7–6.4%). | Calculate 30-year lifetime risk. Screen visceral adiposity using Waist-to-Hip Ratio and baseline BMI. |
| Stage 2 | Metabolic Risk Factors / Moderate CKD | Hypertension, Type 2 diabetes, hypertriglyceridemia (≥ 150 mg/dL), or moderate CKD (eGFR 60–89 with microalbuminuria or eGFR 45–59). | Calculate 10-year Total CVD and Heart Failure risk. Evaluate cardiorenal status with eGFR and FEUrea. |
| Stage 3 | Subclinical CVD in CKM / High Risk | Very high PREVENT risk (≥ 20%), advanced CKD (eGFR < 45 or uACR > 300 mg/g), CAC > 100, or elevated hs-cTn / BNP without clinical symptoms. | Mandates intensive multi-target pharmacotherapy (high-intensity statin, SGLT2i, GLP-1 RA, non-steroidal MRA). |
| Stage 4 | Clinical CVD with CKM Syndrome | Documented established ASCVD (prior MI, coronary revascularization, stroke) or symptomatic Heart Failure (HFpEF or HFrEF). | Patient has already reached secondary prevention; PREVENT is not indicated. For acute post-MI evaluation, utilize the TIMI Risk Score and GRACE Risk Score. |
Clinical Worked Scenarios: PREVENT in Practice
Young Adult with CKM Stage 1: Overcoming the Age Bias
Patient Presentation: A 38-year-old female presents for a routine wellness physical. She has a BMI of 31.5 kg/m², resting blood pressure of 134/86 mmHg (untreated), total cholesterol 215 mg/dL, HDL 44 mg/dL, and eGFR 98 mL/min/1.73m². She does not smoke and does not have diabetes.
Clinical Synthesis: In the legacy 2013 PCE, this patient could not even be evaluated because she was under age 40. Looking solely at her 10-year PREVENT score (1.4%), a clinician might offer casual reassurance. However, evaluating her 30-year lifetime risk reveals a 24.2% probability of experiencing a major cardiovascular event or heart failure before age 68. The physician utilizes the 30-year metric to motivate intensive lifestyle interventions, targeting 7% to 10% weight loss, dietary sodium reduction, and routine exercise to normalize blood pressure without premature polypharmacy.
Stage 3 CKM Syndrome: Unmasking Renal & Heart Failure Danger
Patient Presentation: A 62-year-old male with long-standing Type 2 diabetes presents for risk review. He takes Lisinopril 20 mg daily for hypertension (SBP 142 mmHg). Laboratory values: Total cholesterol 195 mg/dL, HDL 38 mg/dL, BMI 29 kg/m², eGFR 54 mL/min/1.73m², and spot urine ACR 180 mg/g (microalbuminuria). He is a non-smoker on Atorvastatin 20 mg.
Clinical Synthesis: Under the legacy PCE, this patient's calculated ASCVD risk would not have reflected his stage 3 chronic kidney disease or urine albumin leakage, nor would it have quantified heart failure risk. The aha prevent risk calculator reveals that his 10-year risk of developing incident heart failure (12.1%) is higher than his atherosclerotic risk (9.8%). Recognizing this prominent heart failure hazard, the clinician adds an SGLT2 inhibitor (Dapagliflozin or Empagliflozin) and intensifies statin therapy to Rosuvastatin 20 mg, providing simultaneous renal protection, glycemic optimization, and heart failure hospitalization reduction.
Clinical Limitations & Special Patient Populations
While the AHA PREVENT equations represent the state of the art in preventive cardiology, healthcare professionals must recognize specific clinical contexts where the model is not applicable:
- Age Outside 30 to 79 Years: PREVENT has not been calibrated or validated in pediatric or geriatric populations aged 80 and older. In frail elderly adults (>80 years), competing non-cardiovascular causes of mortality and cognitive status dominate clinical decision-making.
- Severe End-Stage Renal Disease (eGFR < 15 mL/min/1.73m² or Dialysis): Patients on chronic hemodialysis or peritoneal dialysis experience non-atherosclerotic vascular calcification, volume shifts, and cardiorenal syndromes that exceed standard proportional hazards assumptions. Dosing and fluid balance in such patients can be evaluated with our Creatinine Clearance and FENA calculators.
- Known Familial Hypercholesterolemia (LDL-C ≥ 190 mg/dL): These individuals possess genetic, lifelong elevations in atherogenic particles. Guideline consensus mandates immediate high-intensity statin therapy regardless of any calculated risk percentage. Compute exact atherogenic fractions with our LDL Cholesterol Calculator.
- Concomitant Medication & Arrhythmia Risk: Patients initiated on multiple cardiovascular or psychotropic agents should have electrocardiographic safety evaluated via the corrected QTc interval calculator.
- Secondary Prevention (Established ASCVD or HF): PREVENT is exclusively a primary prevention tool. Patients who have survived a previous myocardial infarction, stroke, transient ischemic attack, coronary artery bypass graft, or peripheral artery revascularization already have clinical cardiovascular disease and require secondary prevention pathways.
Frequently Asked Questions About the AHA PREVENT™ Calculator
What is the AHA PREVENT risk calculator and how does it differ from the 2013 Pooled Cohort Equations (PCE)?
The AHA PREVENT (Predicting Risk of CVD EVENTs) calculator is the updated clinical standard released by the American Heart Association in late 2023. Unlike the legacy 2013 PCE, PREVENT removes race from risk calculations, lowers the minimum screening age from 40 to 30, models both 10-year and 30-year lifetime risk, incorporates kidney function (eGFR and urine albumin), and predicts Heart Failure alongside traditional ASCVD (heart attack and stroke).
Why did the American Heart Association remove race from the PREVENT equations?
The AHA removed race because rigorous clinical epidemiology demonstrates that race is a social construct rather than a biological determinant of cardiovascular risk. In the older 2013 PCE, race-specific coefficients often perpetuated clinical disparities. PREVENT replaces race with objective biological and metabolic markers, including renal function (eGFR), while offering optional social deprivation index adjustments to address structural inequities directly.
What cardiovascular outcomes does the AHA PREVENT equation estimate?
PREVENT estimates three distinct cardiovascular endpoints: (1) Total CVD (a composite outcome encompassing atherosclerotic disease and heart failure), (2) ASCVD (fatal/nonfatal myocardial infarction and fatal/nonfatal ischemic or hemorrhagic stroke), and (3) Heart Failure (incident heart failure hospitalization or death).
What age group is eligible for the PREVENT calculator, and what are the 10-year vs. 30-year horizons?
The PREVENT equations are validated for asymptomatic adults aged 30 to 79 years without established cardiovascular disease. The 10-year risk horizon evaluates immediate decadal risk for all individuals aged 30-79, while the 30-year lifetime risk horizon is designed for younger adults aged 30 to 59 to detect early cumulative cardiometabolic vulnerability.
Why does the PREVENT calculator include kidney function (eGFR and urine ACR)?
Chronic kidney disease is one of the strongest independent accelerators of vascular calcification, arterial stiffness, and myocardial strain. Impaired eGFR (<60 mL/min/1.73m²) and microalbuminuria (uACR ≥ 30 mg/g) significantly heighten both coronary events and heart failure risk, representing Stage 3 Cardiovascular-Kidney-Metabolic (CKM) syndrome.
How does the Cardiovascular-Kidney-Metabolic (CKM) Syndrome relate to the PREVENT score?
The AHA introduced the CKM syndrome staging framework (Stages 0 through 4) concurrently with the PREVENT equations. PREVENT is the quantitative risk engine for CKM syndrome. Patients in CKM Stage 1 (excess adiposity/prediabetes) or Stage 2 (metabolic risk factors, hypertension, hypertriglyceridemia) use PREVENT to establish baseline risk, while Stage 3 (subclinical kidney injury or high PREVENT score) triggers aggressive multi-organ protective therapies.
Why does my PREVENT score estimate a lower risk percentage than my older ASCVD PCE score?
The older 2013 PCE was derived from historic cohorts dating back to the 1960s-1990s, when cardiovascular death rates were markedly higher and background preventive treatments (like statins) were uncommon. PREVENT was trained on modern cohorts of over 6 million diverse US adults with contemporary medical management. On average, PREVENT scores are 20% to 30% lower than PCE scores, reducing unnecessary overtreatment while identifying patients who truly benefit from preventative pharmacotherapy.
Peer-Reviewed References & Scientific Consensus
- Khan SS, Matsushita K, Sang Y, et al. Development and Validation of the American Heart Association Predicting Risk of Cardiovascular Disease EVENTs (PREVENT) Equations. Circulation. 2024;149(6):430–449. doi:10.1161/CIRCULATIONAHA.123.067626.
- Ndumele CE, Rangaswami J, Chow SL, et al. Cardiovascular-Kidney-Metabolic Health: A Presidential Advisory From the American Heart Association. Circulation. 2023;148(20):1606–1635. doi:10.1161/CIR.0000000000001184.
- Goff DC Jr, Lloyd-Jones DM, Bennett G, et al. 2013 ACC/AHA Guideline on the Assessment of Cardiovascular Risk: A Report of the American College of Cardiology/American Heart Association Task Force on Practice Guidelines. Circulation. 2014;129(25 Suppl 2):S49–S73. doi:10.1161/01.cir.0000437741.48606.98.
- Inker LA, Eneanya ND, Coresh J, et al. New Creatinine- and Cystatin C-Based Equations to Estimate GFR without Race. New England Journal of Medicine. 2021;385(19):1737–1749. doi:10.1056/NEJMoa2102953.
- Grundy SM, Stone NJ, Bailey AL, et al. 2018 AHA/ACC/AACVPR/AAPA/ABC/ACPM/ADA/AGS/APhA/ASPC/NLA/PCNA Guideline on the Management of Blood Cholesterol. Circulation. 2019;139(25):e1082–e1143. doi:10.1161/CIR.0000000000000625.