Bazett
— ms——Calculate the Corrected QT interval (QTc) from a measured QT interval and heart rate or RR interval. Directly compare the four major clinical formulas: Bazett, Fridericia, Framingham, and Hodges, with automated ECG small-box conversion and evidence-based arrhythmia risk stratification.
————The QT interval on a surface 12-lead electrocardiogram (ECG) represents the total duration of electrical activity in the ventricular myocardium. It spans from the earliest onset of ventricular depolarization (the start of the Q wave, or R wave if Q is absent) to the final completion of ventricular repolarization (the point where the downslope of the T wave merges back into the isoelectric baseline).
At the cellular level, the QT interval encompasses the entirety of the cardiac ventricular action potential (Phases 0 through 3):
Crucially, ventricular action potential duration is intrinsically rate-dependent. When the heart rate accelerates, sympathetic tone, increased intracellular calcium, and potassium channel activation shorten action potential duration to preserve diastolic ventricular filling time. Conversely, when the heart rate slows, repolarization duration prolongs. Consequently, a raw measured QT interval of 420 ms is perfectly normal at a heart rate of 60 beats per minute, but dangerously prolonged at a heart rate of 110 beats per minute. Calculating the corrected QT interval (QTc) standardizes repolarization duration to an idealized heart rate of 60 beats per minute ($RR = 1.0\text{ second}$), allowing clinicians to assess arrhythmia risk across varying heart rates.
When evaluating patients with suspected acute cardiac ischemia, integrate QTc analysis with risk stratification from the HEART Score Calculator, evaluate systemic perfusion with the Mean Arterial Pressure Calculator, and correct for electrolyte disturbances using our Corrected Calcium Calculator.
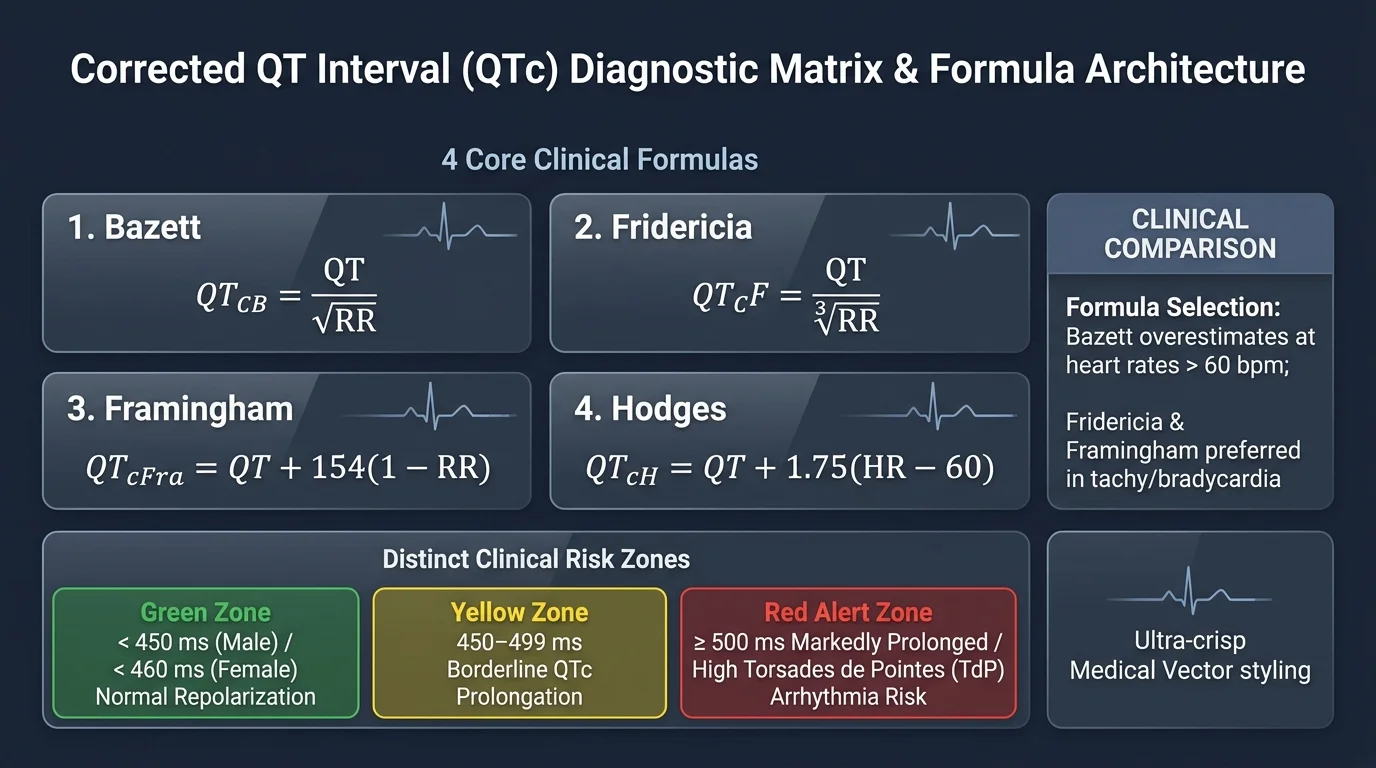
Because no single mathematical model perfectly captures the non-linear biological relationship between heart rate and cardiac repolarization across all physiological states, multiple formulas exist in contemporary electrophysiology:
| Formula Name | Mathematical Equation | Input Variable Units | Clinical Characteristics & Recommended Use |
|---|---|---|---|
| Bazett (1920) Most Common |
$$\text{QTcB} = \frac{\text{QT}}{\sqrt{\text{RR}}}$$ | QT in ms or sec; RR in seconds |
Default algorithm on most commercial ECG carts. Overestimates QTc in tachycardia (> 60 bpm) and underestimates in bradycardia (< 60 bpm). |
| Fridericia (1932) AHA / FDA Standard |
$$\text{QTcF} = \frac{\text{QT}}{\sqrt[3]{\text{RR}}}$$ | QT in ms or sec; RR in seconds |
Uses cube root of RR. Significantly more stable at high and low heart rates. Mandatory regulatory standard for FDA / ICH E14 drug trials. |
| Framingham (1992) Linear Population Model |
$$\text{QTcFra} = \text{QT} + 154 \times (1 - \text{RR})$$ | QT in ms; RR in seconds |
Derived from 5,018 Framingham Heart Study subjects. Demonstrates superior rate-independence across physiological heart rates (60–100 bpm). |
| Hodges (1983) Direct Heart Rate Model |
$$\text{QTcH} = \text{QT} + 1.75 \times (\text{HR} - 60)$$ | QT in ms; HR in bpm |
Linear correction using beats per minute directly. Eliminates RR conversion step; performs exceptionally well in outpatient monitoring. |
Automated computer algorithms on standard ECG carts have an error rate exceeding 15% in measuring QT intervals, frequently mistaking prominent U waves for T waves or misidentifying baseline noise. Healthcare professionals must manually verify QT intervals using the Maximum Slope-Intercept (Tangent) Method:
Lead II and lead V5 typically display the clearest QRS onset, the highest T-wave amplitude, and the best separation between T and U waves. Avoid lead aVR and aVL where T-wave vectors are often flat or biphasic.
Locate the initial deflection of the QRS complex (first downward Q wave or upward R wave) from the PR segment baseline.
Draw a straight tangent line along the steepest portion of the terminal downslope of the T wave. The end of the QT interval is defined as the point where this tangent line intersects the isoelectric baseline (the TP segment).
If a discrete U wave follows the T wave (common in hypokalemia or bradycardia), end the QT measurement at the nadir between the T wave and U wave. Only include the U wave if it is pathologically merged into the T wave.
On standard ECG paper at 25 mm/s, each 1 mm small box equals 40 ms (0.04 s), and each 5 mm large box equals 200 ms (0.20 s). Multiply small box count across the QT interval by 40.
Measure the distance in small boxes between the R wave of the measured beat and the R wave of the preceding beat. If the rhythm is sinus arrhythmia, average 3 to 5 consecutive cycles.
Patient Presentation: A 28-year-old female presents to the emergency department with acute severe palpitations, diaphoresis, and anxiety following an intense panic attack. A 12-lead ECG confirms sinus tachycardia at a heart rate of 118 bpm ($RR = 0.508\text{ s}$). Automated computer interpretation alerts: "Prolonged QTc (435 ms), evaluate for Long QT Syndrome."
Clinical Synthesis & Management: The automated ECG interpretation generated a false-positive long QT warning because it relied exclusively on Bazett's formula. At a heart rate of 118 bpm, $\sqrt{RR}$ shrinks excessively ($0.713$), causing an artificial $+47\text{ ms}$ overcorrection compared to Fridericia and Framingham. The patient's true repolarization duration ($388\text{ ms}$) is well within normal limits for an adult female (< 460 ms). Recognizing this formula artifact prevents unnecessary hospital admission, unnecessary genetic testing for congenital channelopathies, and inappropriate avoidance of required medications. The emergency physician provides reassurance, monitors blood pressure with the Mean Arterial Pressure Calculator, and discharges the patient safely.
Patient Presentation: A 64-year-old male with chronic depression managed with citalopram 40 mg daily is prescribed a 5-day course of oral azithromycin for community-acquired pneumonia. On day 3, he presents following an episode of sudden syncope while walking. ECG reveals sinus rhythm at 64 bpm ($RR = 0.938\text{ s}$).
Clinical Synthesis & Management: All four formulas unanimously confirm dangerous repolarization prolongation exceeding the critical $\ge 500\text{ ms}$ threshold. This presentation represents classic drug-induced long QT syndrome precipitated by dual hERG potassium channel blockade (citalopram + azithromycin) exacerbated by hypokalemia and hypomagnesemia. Low extracellular potassium paradoxical impairs $I_{\text{Kr}}$ channel conductance and increases sensitivity to drug blockade. The patient's syncope was almost certainly self-terminating Torsades de Pointes. The medical team immediately transfers the patient to cardiac telemetry, stops both citalopram and azithromycin, infuses 2 grams of intravenous magnesium sulfate, replenishes potassium to a high-normal target of 4.5–5.0 mEq/L, and monitors serum osmolality using the Serum Osmolality Calculator. Repeat ECG 24 hours later shows QTc normalization to 442 ms.
Cardiology consensus statements from the American Heart Association (AHA), Heart Rhythm Society (HRS), and European Society of Cardiology (ESC) classify adult QTc intervals based on sex-specific repolarization thresholds:
| Diagnostic Category | Adult Male QTc Threshold | Adult Female QTc Threshold | Clinical Significance & Electrophysiologic Action |
|---|---|---|---|
| Normal Repolarization | < 430 ms (ideal) / < 450 ms | < 440 ms (ideal) / < 460 ms | Normal physiological repolarization. Safe for standard medical therapy. |
| Borderline Prolongation | 450 ms to 470 ms | 460 ms to 480 ms | Review medication lists for QT-prolonging drugs; check baseline serum electrolytes ($\text{K}^+$, $\text{Mg}^{2+}$, $\text{Ca}^{2+}$). |
| Abnormal (Prolonged QTc) | > 470 ms | > 480 ms | Definite repolarization delay. Avoid adding additional QT-prolonging agents; serial ECG monitoring indicated. |
| Critical High-Risk Threshold | ≥ 500 ms | ≥ 500 ms | High Torsades de Pointes Risk: Immediate telemetry, stop offending drugs, replete $\text{K}^+ \ge 4.5\text{ mEq/L}$, IV magnesium sulfate. |
| Short QT Syndrome (SQTS) | < 340 ms to 350 ms | < 340 ms to 350 ms | Pathologically shortened refractory period; predisposes to ventricular fibrillation and sudden cardiac death. |
Potential Short QT Syndrome, hypercalcemia, digitalis effect, or severe acidosis.
Physiologically normal ventricular repolarization in healthy adults.
Requires drug review, electrolyte repletion, and formula cross-validation.
Critical threshold: 2- to 3-fold surge in polymorphic VT / Torsades de Pointes risk.
Standard rate-correction formulas assume normal intraventricular conduction (QRS < 100 ms). When cardiac conduction is abnormal, applying standard QTc formulas produces invalid results:
Drug-induced QT prolongation is the most common cause of acquired long QT syndrome in clinical practice. The vast majority of offending agents block the rapid delayed rectifier potassium channel ($I_{\text{Kr}}$ encoded by the hERG gene):
Measure the raw QT interval (from QRS onset to T-wave end) and the preceding RR interval on a standard 12-lead ECG. Then apply a heart-rate correction formula. The most common formulas are Bazett (QTcB = QT ÷ √RR), Fridericia (QTcF = QT ÷ ∛RR), Framingham [QTcFra = QT + 154 × (1 − RR)], and Hodges [QTcH = QT + 1.75 × (HR − 60)]. QT is expressed in milliseconds, while RR is expressed in seconds (or 60 ÷ HR).
The Bazett formula divides the QT interval by the square root of the RR interval. Mathematically, a square root relationship is too steep when heart rates diverge from 60 beats per minute. At tachycardic rates (> 100 bpm), the short RR interval produces an excessively small denominator, artificially inflating the calculated QTcB and generating false-positive long QT alarms. Conversely, in bradycardia (< 60 bpm), Bazett undercorrects and may miss true QT prolongation.
The American Heart Association (AHA), American College of Cardiology Foundation (ACCF), and Heart Rhythm Society (HRS) consensus guidelines recommend linear correction formulas (such as Framingham or Hodges) or the cube-root Fridericia formula over Bazett, especially during tachycardia or bradycardia. Fridericia (QTcF) is also the regulatory standard mandated by the FDA and International Council for Harmonisation (ICH E14) for clinical drug-safety trials.
In adult men, a normal QTc is below 450 ms; 450 to 470 ms is considered borderline prolonged, and > 470 ms is abnormal. In adult women, normal QTc is below 460 ms; 460 to 480 ms is borderline, and > 480 ms is abnormal. Female ventricular repolarization is naturally longer due to estrogenic effects and lower testosterone-mediated potassium currents.
A QTc of 500 ms or greater represents a critical clinical threshold associated with a substantially elevated risk of early afterdepolarizations (EADs), polymorphic ventricular tachycardia, and fatal Torsades de Pointes (TdP). Patients with QTc ≥ 500 ms require immediate clinical evaluation, continuous telemetry monitoring, withdrawal of QT-prolonging medications, and urgent correction of electrolyte deficits (potassium, magnesium, and calcium).
On standard ECG paper running at 25 mm/s, each small 1 mm box represents 40 milliseconds (0.04 seconds). Count the number of small boxes between the beginning of the QRS complex and the point where the T-wave returns to the isoelectric baseline, then multiply by 40 ms. If using 50 mm/s paper speed, multiply each small box by 20 ms. Enter this millisecond value alongside heart rate into the calculator.
In Left or Right Bundle Branch Block (QRS ≥ 120 ms) or ventricular pacing, the QT interval is prolonged simply because ventricular depolarization takes longer, not because repolarization is impaired. Applying standard formulas overestimates arrhythmia risk. Clinicians evaluate the JT interval (JT = QT − QRS, then corrected as JTc = JT ÷ √RR, normal < 340 ms) or use modified QTc equations such as the Rautaharju formula: QTc.adj = QTc − (0.485 × QRS) or Bogossian formula: QTc.adj = QT − (0.5 × QRS) corrected for rate.
Editorial review completed September 11, 2026. Formulas and clinical thresholds verified against AHA, ACC, HRS, and ESC guidelines. Calculations are computed locally in your web browser.