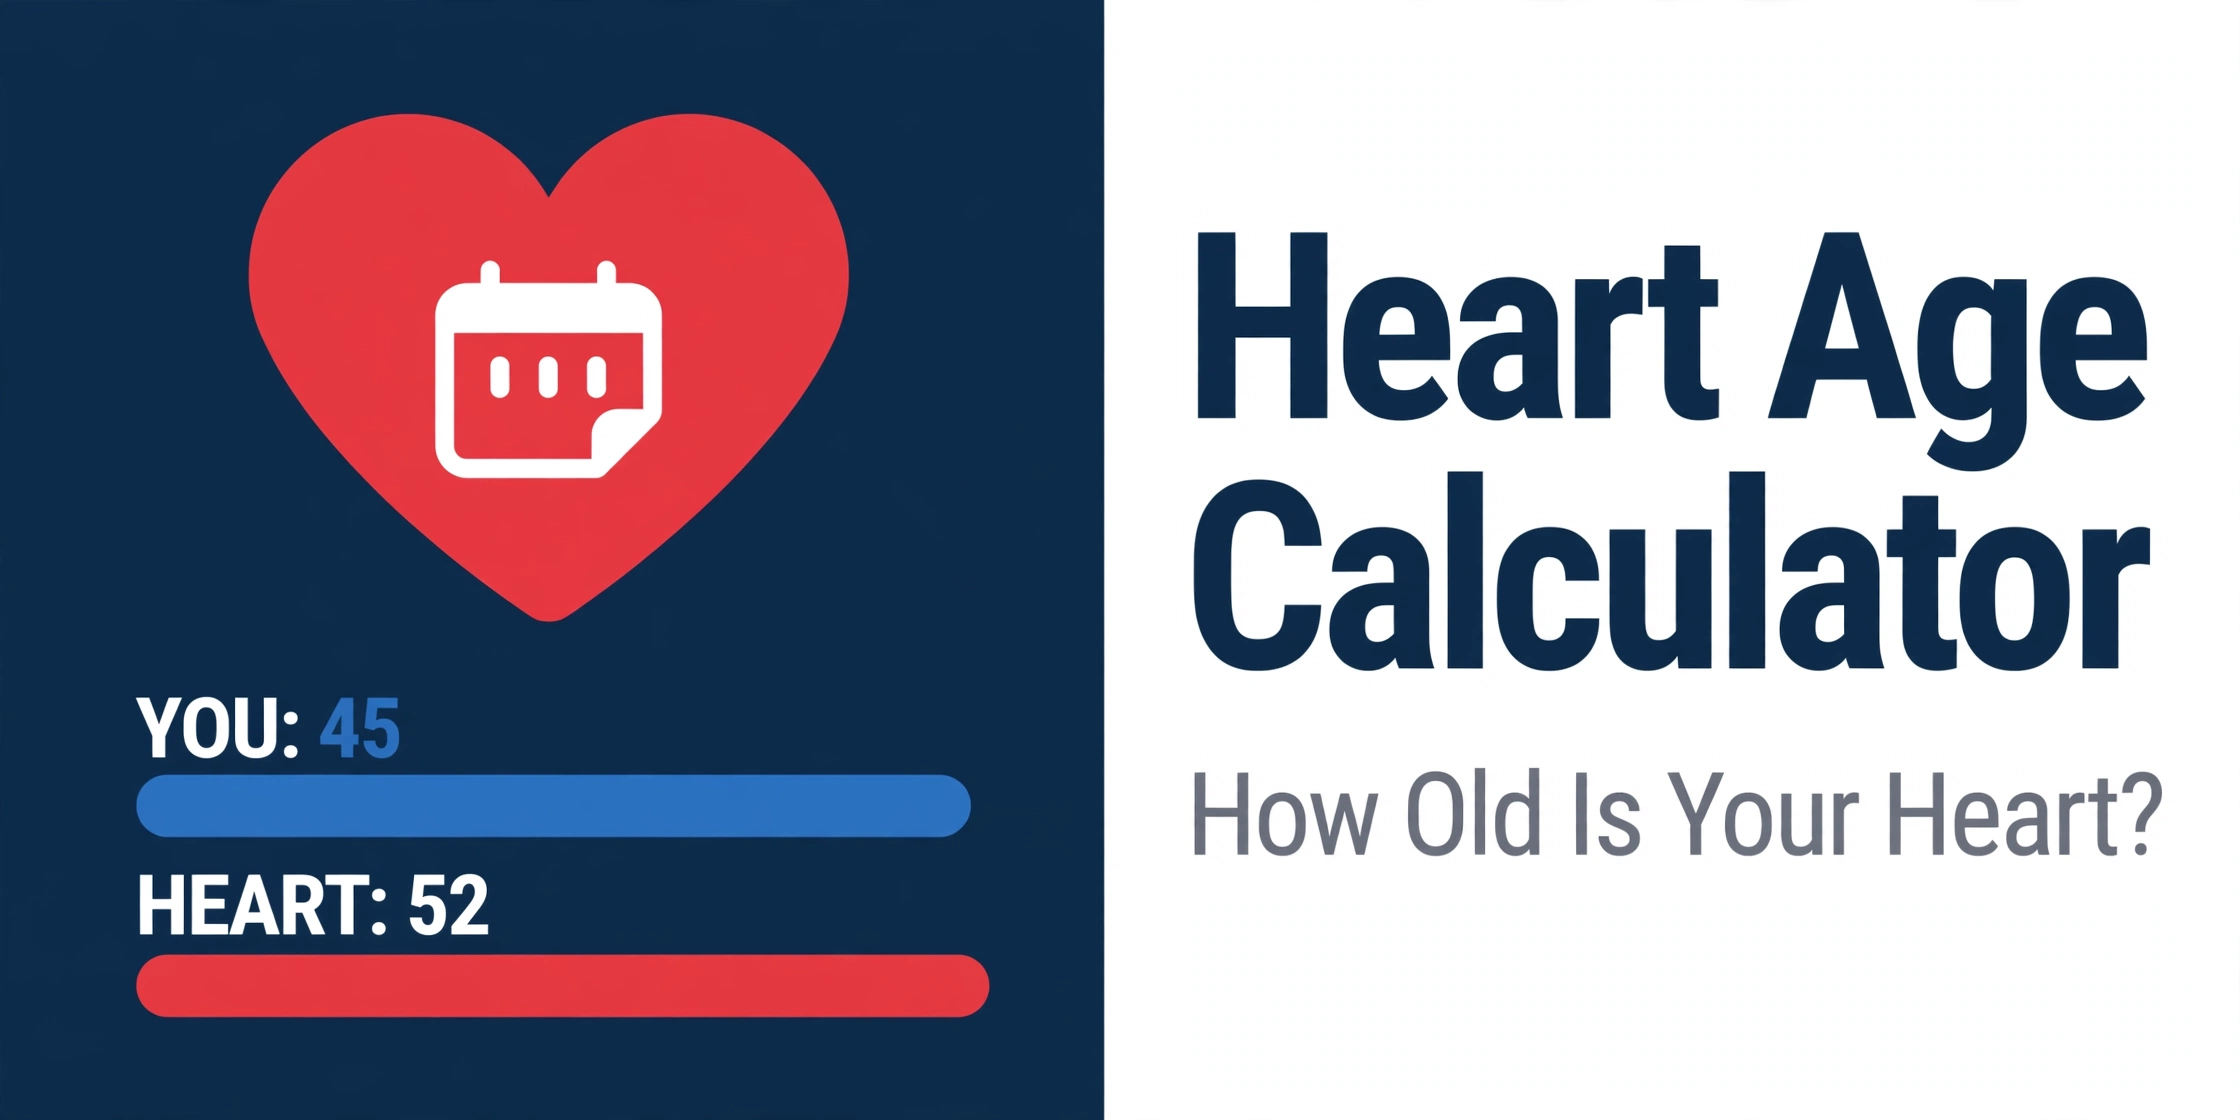
What Is Heart Age?
Heart age — also called vascular age — is a risk communication metric. It answers one question: at what chronological age would a person with normal risk factors have the same 10-year cardiovascular risk that the model predicts for you?
A 52-year-old with a heart age of 57 carries the estimated risk profile of a typical 57-year-old with normal blood pressure, cholesterol, and no smoking or diabetes. A 52-year-old with a heart age of 45 scores like a typical 45-year-old. The number reframes an abstract percentage — for example, 11.2% 10-year risk — into an intuitive comparison. Our explainer on what heart age means covers the concept in plain language.
The concept comes from the Framingham Heart Study. In 2008, D’Agostino and colleagues published sex-specific point tables that convert the Framingham general cardiovascular disease risk function into an integer score (Circulation 2008). Alongside the 10-year risk tables, they published companion heart-age tables (Tables 9 and 10) mapping the same point total directly to a heart age. The derivation cohort included 8,491 Framingham participants, ages 30 to 74, free of cardiovascular disease at baseline and followed for up to 12 years; the model showed good discrimination (C statistic 0.763 in men and 0.793 in women) with good calibration.
Heart age is sometimes described as vascular age because it reflects the estimated condition of the arteries rather than the heart muscle itself. The two terms describe the same calculation.
How Heart Age Is Calculated: The Framingham Method
The Framingham method assigns integer points to each risk factor using the published score sheets (Tables 5 and 7 of D’Agostino et al.). Points are summed, and the same total is converted twice: once into a 10-year general CVD risk (Tables 6 and 8) and once into a heart age (Tables 9 and 10). One total, two readings.
The table below excerpts the published point values. Age dominates the score — the single largest point source — which is why heart age tracks chronological age closely in people with otherwise normal factors.
| Risk factor | Category | Points (men) | Points (women) |
|---|---|---|---|
| Age (years) | 30–34 | 0 | 0 |
| 35–39 | 2 | 2 | |
| 40–44 | 5 | 4 | |
| 45–49 | 6 | 5 | |
| 50–54 | 8 | 7 | |
| 55–59 | 10 | 8 | |
| 60–64 | 11 | 9 | |
| 65–69 | 12 | 10 | |
| 70–74 | 14 | 11 | |
| 75+ | 15 | 12 | |
| HDL cholesterol (mg/dL) | ≥60 | −2 | −2 |
| 50–59 | −1 | −1 | |
| 45–49 | 0 | 0 | |
| 35–44 | 1 | 1 | |
| <35 | 2 | 2 | |
| Total cholesterol (mg/dL) | <160 | 0 | 0 |
| 160–199 | 1 | 1 | |
| 200–239 | 2 | 3 | |
| 240–279 | 3 | 4 | |
| ≥280 | 4 | 5 | |
| Smoking | Current smoker | 4 | 3 |
| Diabetes | Present | 3 | 4 |
Systolic blood pressure uses separate bands depending on treatment status, because the same reading carries different meaning on and off medication:
| SBP, not on treatment (mmHg) | Men | Women | SBP, on treatment (mmHg) | Men | Women |
|---|---|---|---|---|---|
| <120 | −2 | −3 | <120 | 0 | −1 |
| 120–129 | 0 | 0 | 120–129 | 2 | 2 |
| 130–139 | 1 | 1 | 130–139 | 3 | 3 |
| 140–159 | 2 | — | 140–159 | 4 | — |
| 140–149 | — | 2 | 140–149 | — | 5 |
| 150–159 | — | 4 | 150–159 | — | 6 |
| ≥160 | 3 | 5 | ≥160 | 5 | 7 |
Total points = age + HDL + total cholesterol + SBP + smoking + diabetes
10-year risk = Table 6/8 lookup(total points)
Heart age    = Table 9/10 lookup(total points)
For example, a total of 11 points in a man corresponds to 11.2% 10-year risk (Table 8) and a heart age of 57 years (Table 10). The calculator above performs all three lookups automatically and shows the point-by-point breakdown under the result. The method’s details, including the full score sheets, are documented in the Framingham Risk Score calculator.
The PREVENT-Based Method
The second tab estimates heart age from the American Heart Association PREVENT equations (Khan et al., Circulation 2024) — the 2023 successor to the older pooled cohort equations. PREVENT estimates 10-year total cardiovascular disease (atherosclerotic events plus heart failure) in adults 30 to 79, using sex-specific equations derived and validated in more than 6 million US adults. Our PREVENT calculator implements the full base model.
The approach has two steps. First, the calculator computes the PREVENT base-model 10-year risk from the entered profile — including eGFR, which the PREVENT base model requires, so the tab adds that input. Second, it searches for the age at which a reference profile — SBP 110 mmHg without treatment, total cholesterol 170 mg/dL, HDL 60 mg/dL, eGFR 95, no smoking, no diabetes, no medications — produces the same 10-year risk. That age is reported as the PREVENT-based heart age.
Two caveats apply. Because PREVENT was validated for ages 30 to 79, matches outside that window are extrapolations; results below 30 or above 80 display as “<30” and “>80”. And unlike the Framingham tables, this age-matching procedure is an estimation approach built on PREVENT, not a metric the PREVENT investigators published — it is labeled as such in the result.
The two methods rest on different cohorts, different endpoints, and different eras — Framingham examinations from 1968–1987 with a general CVD endpoint versus contemporary US health records with a total CVD endpoint. Modest disagreement between the two heart ages is expected; each adds context to the other rather than contradicting it.
What Does It Mean If Your Heart Age Is Older?
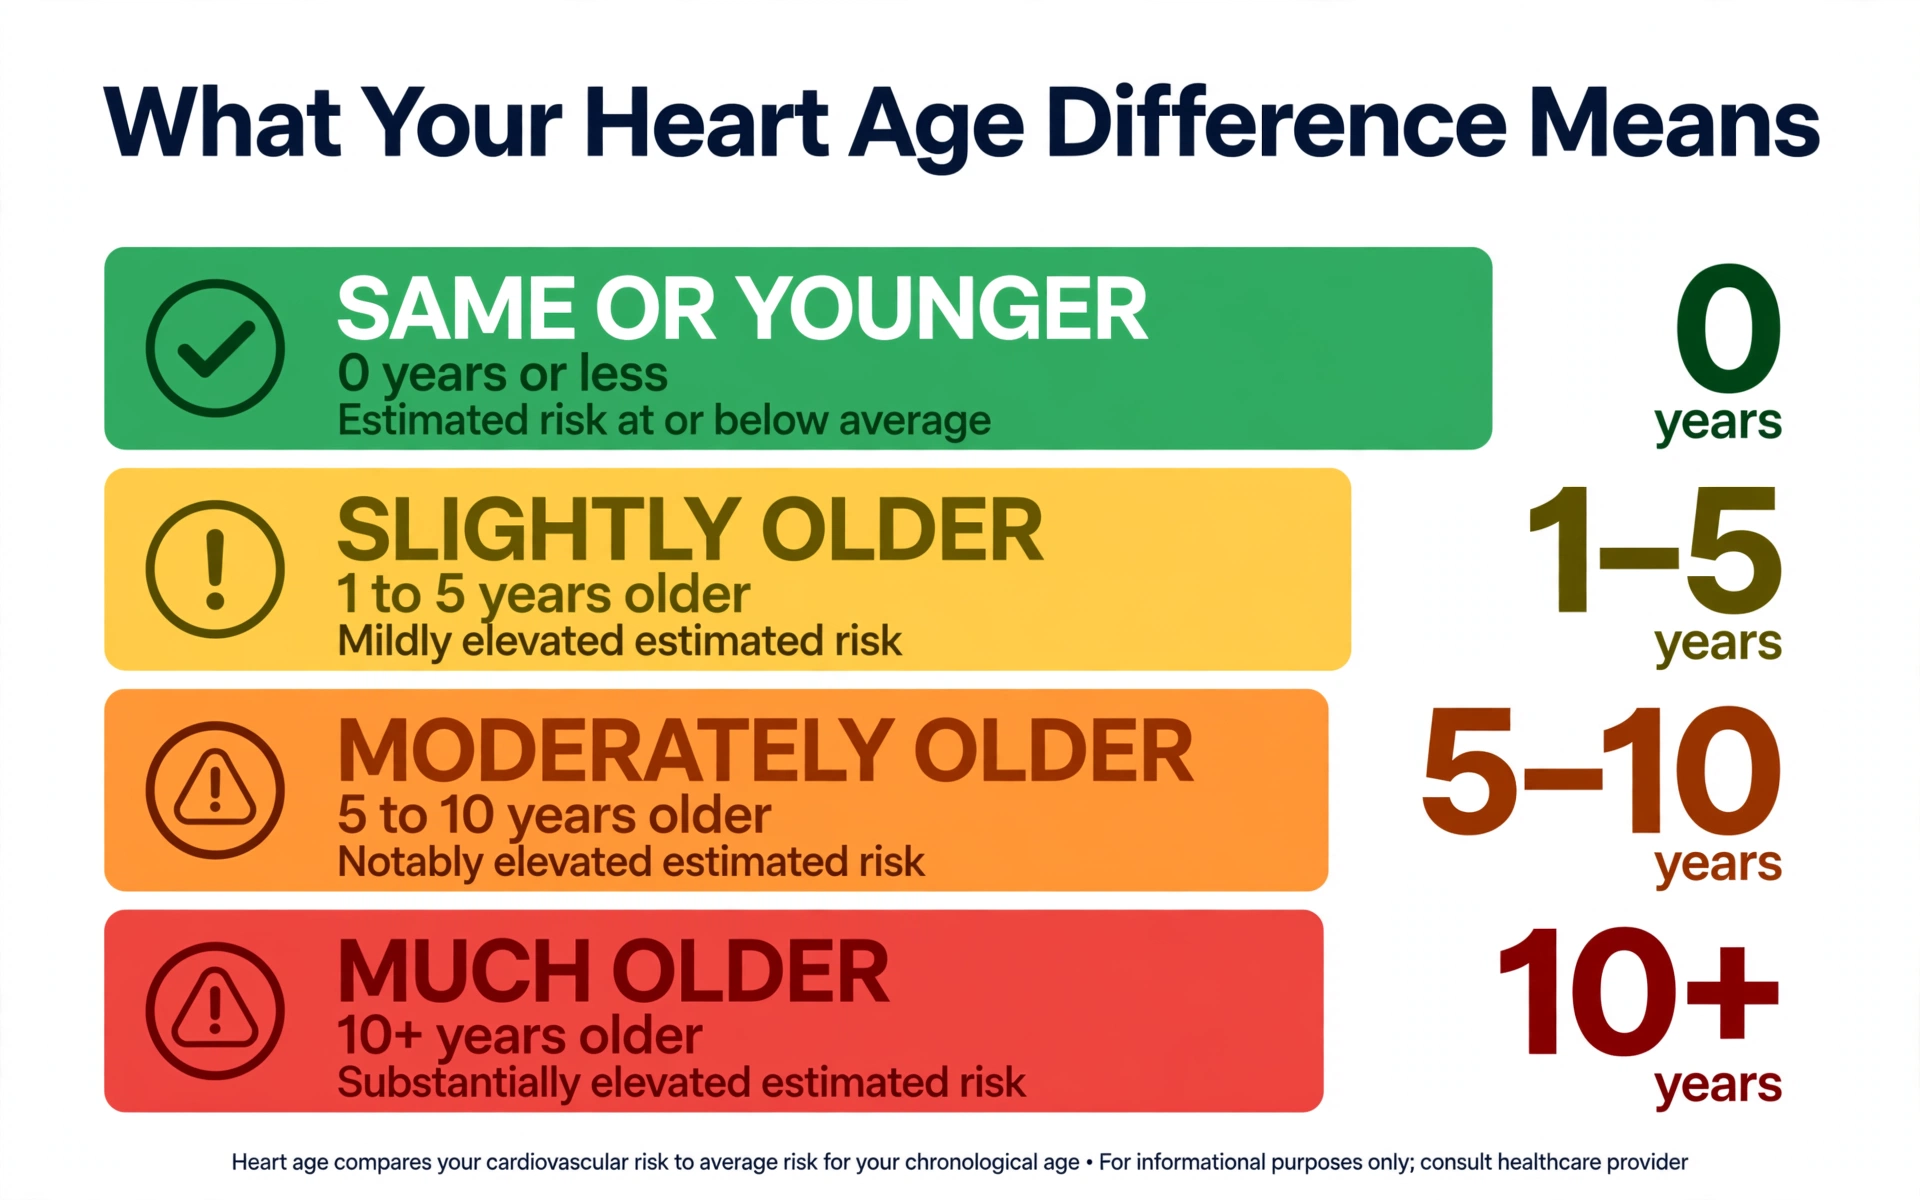
A heart age above chronological age means the model’s estimated 10-year risk exceeds the risk of a typical person of the same age and sex with normal risk factors. It is a population-level comparison, not a personal prediction: most people at any estimated risk level do not experience an event within 10 years, and some at low estimated risk do.
| Gap (heart age − actual age) | Category | What it reflects |
|---|---|---|
| Below 0 | Younger than actual | Estimated risk below the age-typical level for that sex |
| 0 | Same as actual | Estimated risk matches the model’s expectation for that age |
| +1 to +5 years | Older by 1–5 years | Modestly elevated estimated risk versus age peers |
| +6 years or more | Older by 5+ years | Substantially elevated estimated risk versus age peers |
A large positive gap usually traces to one or two heavily weighted factors — current smoking (3–4 points), diabetes (3–4 points), or markedly elevated systolic pressure — which the point breakdown under the result makes visible. A gap near zero means the profile scores about as the model expects for that age; a negative gap means the profile scores better than age-typical. Because the inputs are snapshots — a single blood pressure reading, one lipid panel — repeat measurement can shift the number, which is normal variation rather than a change in the arteries themselves.
7 Ways to Lower Your Heart Age
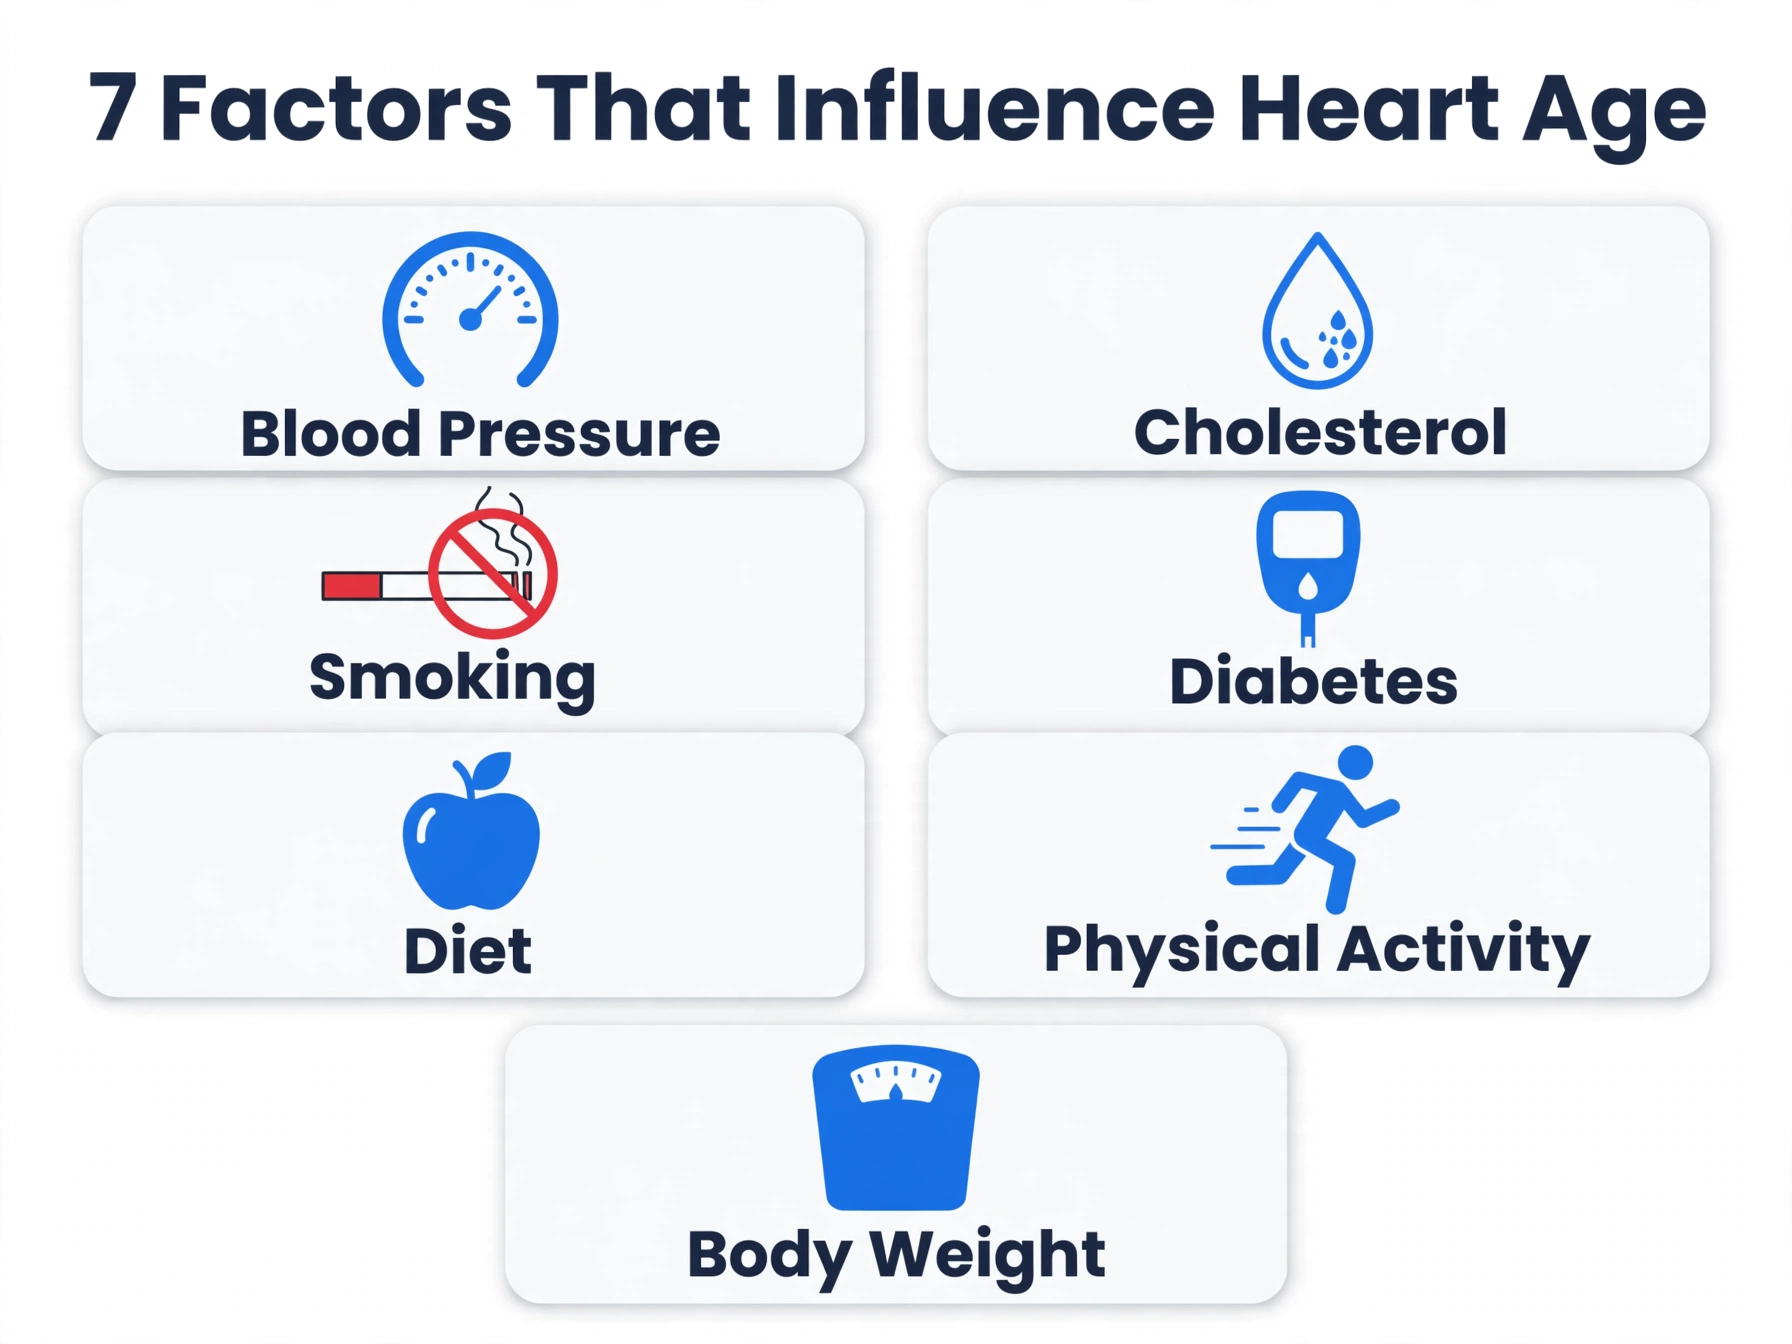
Because heart age is arithmetic, each factor’s contribution is visible in the point tables. Population research associates the following patterns with lower point totals and therefore younger heart ages. Nothing here is a prescription — risk-factor management is an individual clinical decision made with a qualified clinician.
1. Systolic blood pressure in the normal range
In the Framingham sheets, untreated SBP below 120 mmHg earns −2 points (men) or −3 (women), while 140–159 earns +2 — a swing of 4–5 points from pressure alone. Population studies link lower average systolic pressure with lower cardiovascular event rates across age groups.
2. Not smoking
Current smoking adds 4 points (men) or 3 (women) — the single largest modifiable increment in the tables, equivalent to roughly a decade of arterial aging in the heart-age lookup. Cohort research associates smoking cessation with declining cardiovascular risk over subsequent years.
3. A favorable cholesterol balance
Total cholesterol below 160 mg/dL earns 0 points versus up to +4 (men) or +5 (women) at ≥280; HDL at or above 60 earns −2 versus +2 below 35. Our LDL cholesterol calculator explains the lipid fractions in more detail. Large trials associate lower LDL cholesterol with fewer atherosclerotic events, with benefits proportional to the reduction achieved.
4. Absence of diabetes
Diabetes contributes 3 points (men) or 4 (women) — among the strongest single predictors of incident CVD in the Framingham derivation cohort. Population research associates well-managed blood glucose with lower event rates than poorly managed diabetes, though the point tables score only presence versus absence.
5. Healthy body weight
BMI is not a Framingham 2008 input, but higher body weight is associated in population research with higher blood pressure, adverse lipid patterns, and higher diabetes incidence — the very factors the model does score. Weight change therefore reaches heart age indirectly through those inputs.
6. Regular physical activity
Activity is not scored directly, yet cohort studies consistently associate regular aerobic activity with lower resting blood pressure and healthier lipid profiles. In the calculator, the effect appears through the SBP and cholesterol inputs rather than as its own line item.
7. Limited alcohol intake
Heavy alcohol intake is associated with higher systolic pressure in population studies; the model captures the downstream effect through the SBP points. Intake itself has no dedicated row in the Framingham sheets.
Heart Age vs ASCVD Risk Score
Heart age and the 10-year ASCVD risk percentage are two presentations of related model output. The ASCVD risk estimator on this site’s homepage — built on the 2013 Pooled Cohort Equations — reports an absolute probability, for example 7.5%, for atherosclerotic events (heart attack and stroke) only. Heart age converts a general-CVD risk estimate into an age analogy.
The endpoints differ. The Framingham general CVD endpoint behind the heart-age tables is broader than ASCVD: it adds heart failure, peripheral artery disease, and transient ischemic attack to coronary disease and stroke. The PREVENT-based method estimates total CVD including heart failure. Because the outcomes are not the same, the underlying percentages are not interchangeable with a homepage ASCVD estimate, even when the inputs match.
The two formats serve different purposes. Percentages support treatment-threshold decisions in clinical guidelines — for instance, the 7.5% marker used in blood pressure management. Heart age supports intuitive understanding: “my arteries score like those of a 57-year-old” is easier to grasp than “11.2% 10-year general CVD risk.” Used together, the percentage provides the clinical anchor and the heart age provides the motivation.
Limitations
No risk model captures every determinant of cardiovascular disease. The limitations below apply to both methods on this page:
- Derivation era (Framingham). The point tables come from examinations conducted between 1968 and 1987. Risk-factor distributions, smoking prevalence, and preventive treatment have changed substantially since, which affects calibration in contemporary populations.
- Derivation population. The Framingham cohort was predominantly white and US-based; the model’s transportability to other populations varies, and recalibration is often needed. PREVENT was derived in contemporary US health-system populations, which limits its generalizability outside the United States.
- Validated age ranges. Framingham 2008 studied ages 30 to 74; PREVENT covers 30 to 79. Inputs outside those windows — and heart-age matches beyond them — are extrapolations, displayed here as “<30” or “>80”.
- Missing predictors. Neither method scores family history of premature CVD, lipoprotein(a), high-sensitivity CRP, coronary artery calcium, or inflammatory conditions. These factors can refine a clinical assessment beyond the model.
- Point-system rounding. Integer points approximate the underlying continuous risk function; two profiles with the same total can have slightly different true risks, and band boundaries create small jumps.
- PREVENT age-matching is an estimation. The PREVENT investigators did not publish a heart-age metric; the second tab’s procedure is this site’s estimation approach built on their equations and is labeled as such.
- Snapshot inputs. Blood pressure and cholesterol vary between readings and over time. A single measurement can move the estimate by several years without any change in underlying vascular health.
- Not a diagnosis. Heart age cannot detect disease, image arteries, or predict any individual’s outcome. It is a communication aid for population-derived estimates.
Worked Example
Profile: 52-year-old man. Systolic BP 138 mmHg, not on BP medication. Total cholesterol 210 mg/dL, HDL 45 mg/dL. Non-smoker, no diabetes.
Step 1 — age points. Age 50–54 in the men’s sheet = 8 points.
Step 2 — HDL points. HDL 45–49 = 0 points.
Step 3 — total cholesterol points. 200–239 mg/dL = 2 points.
Step 4 — SBP points. 130–139 mmHg, not treated = 1 point.
Step 5 — smoking and diabetes. Non-smoker = 0; no diabetes = 0 points.
Step 6 — lookups. Total = 8 + 0 + 2 + 1 + 0 + 0 = 11 points. Table 8 converts 11 points to 11.2% 10-year general CVD risk; Table 10 converts 11 points to a heart age of 57 years.
Meaning: this profile’s estimated 10-year risk matches that of a typical 57-year-old man with normal risk factors — a gap of +5 years, in the “older by 1–5 years” band. The point breakdown shows the largest contributors are age itself (8 points) plus the cholesterol and pressure increments. Enter these values in the calculator above to reproduce the result.
Key Takeaways
- Heart age is the age at which normal risk factors would produce your estimated 10-year risk (D’Agostino et al., 2008).
- The Framingham method uses published point tables — the same point total yields the 10-year risk and the heart age.
- The PREVENT-based method matches your PREVENT 10-year risk to a reference profile’s age — an estimation approach, not a published metric.
- A gap of 5+ years signals substantially elevated estimated risk versus age peers; the point breakdown shows which factors drive it.
- Heart age is a communication tool, not a diagnosis — single readings vary, and the models omit several known predictors.
Using This Calculator Well
Cholesterol and blood pressure change over time. Re-running the calculator after new measurements keeps the estimate current.
Framingham and PREVENT rest on different cohorts and eras. Viewing both heart ages side by side adds context a single number cannot.
Neither method scores family history of premature cardiovascular disease. Clinicians weigh it separately alongside the model output.
The print button produces a one-page summary — inputs, point breakdown, both risk readings — suitable for a clinical visit.
Frequently Asked Questions
What is a good heart age?
A heart age at or below chronological age indicates estimated risk at or below the age-typical level. A gap of zero means the profile matches the model’s expectation for that age and sex. Small positive gaps are common in middle age as blood pressure and cholesterol rise; larger gaps usually trace to smoking, diabetes, or markedly elevated pressure.
Can my heart age be younger than my actual age?
Yes. Profiles with blood pressure below 120, HDL at or above 60, total cholesterol below 160, and no smoking or diabetes accumulate negative points, which can push the total below the age-typical level. The Framingham heart-age tables report these results as ‘<30’ when the point total falls below the table’s lower bound.
How is heart age different from my 10-year risk percentage?
They present the same model output in different units. The percentage is an absolute probability — for example, 11.2% estimated chance of a cardiovascular event within 10 years. Heart age translates that probability into an age analogy: the age of a person with normal risk factors carrying the same estimated risk. Percentages guide thresholds; heart age aids intuition.
Why do the Framingham and PREVENT methods give different heart ages?
The methods rest on different science. Framingham 2008 used examinations from 1968–1987 with a general CVD endpoint; PREVENT used contemporary US health records with a total CVD endpoint including heart failure. They weight risk factors differently and cover different eras, so modest disagreement is expected and each adds context to the other.
Is heart age a medical diagnosis?
No. Heart age is a population-based risk communication metric derived from epidemiological models. It cannot detect heart disease, image arteries, or predict any individual’s outcome. Clinicians use it alongside history, examination, and testing. Treat the result as an educational estimate and discuss risk-factor questions with a qualified clinician.
Clinical Sources & Citations
- D’Agostino RB Sr, Vasan RS, Pencina MJ, Wolf PA, Cobain M, Massaro JM, Kannel WB. General cardiovascular risk profile for use in primary care: the Framingham Heart Study. Circulation. 2008;117(6):743-753. doi:10.1161/CIRCULATIONAHA.107.699579
- Khan SS, Coresh J, Pencina MJ, et al. Novel prediction equations for absolute risk assessment of total cardiovascular disease incorporating cardiovascular-kidney-metabolic health: a scientific statement from the American Heart Association. Circulation. 2024;149(6):430-449. doi:10.1161/CIRCULATIONAHA.123.067626
- Mahmood SS, Levy D, Vasan RS, Wang TJ. The Framingham Heart Study and the epidemiology of cardiovascular disease: a historical perspective. Lancet. 2014;383(9921):999-1008. doi:10.1016/S0140-6736(13)61752-3
- American Heart Association. PREVENT equations frequently asked questions. heart.org. Accessed October 2026.
- Csenteri O, et al. Differences between SCORE, Framingham Risk Score, and estimated pulse wave velocity-based vascular age calculation methods. J Clin Med. 2024;13(1):205. doi:10.3390/jcm13010205
Editorial review statement: This page was reviewed by the Heart Score Calculator editorial team in October 2026 for formula accuracy, citation integrity, and readability. Content is updated when guidelines change.
Documents the published equation, required inputs, intended population, and known limitations for each tool. This editorial work does not replace advice from a licensed healthcare professional.
Primary sources for this calculator: D’Agostino et al. Circulation 2008 (point tables, 10-year risk tables, and heart-age/vascular-age tables — Tables 5 through 10); Khan et al. Circulation 2024 (PREVENT base-model coefficients); AHA PREVENT scientific statement. Point lookups were cross-checked against the published paper tables.