Waist-to-Height Ratio (WHtR) Calculator
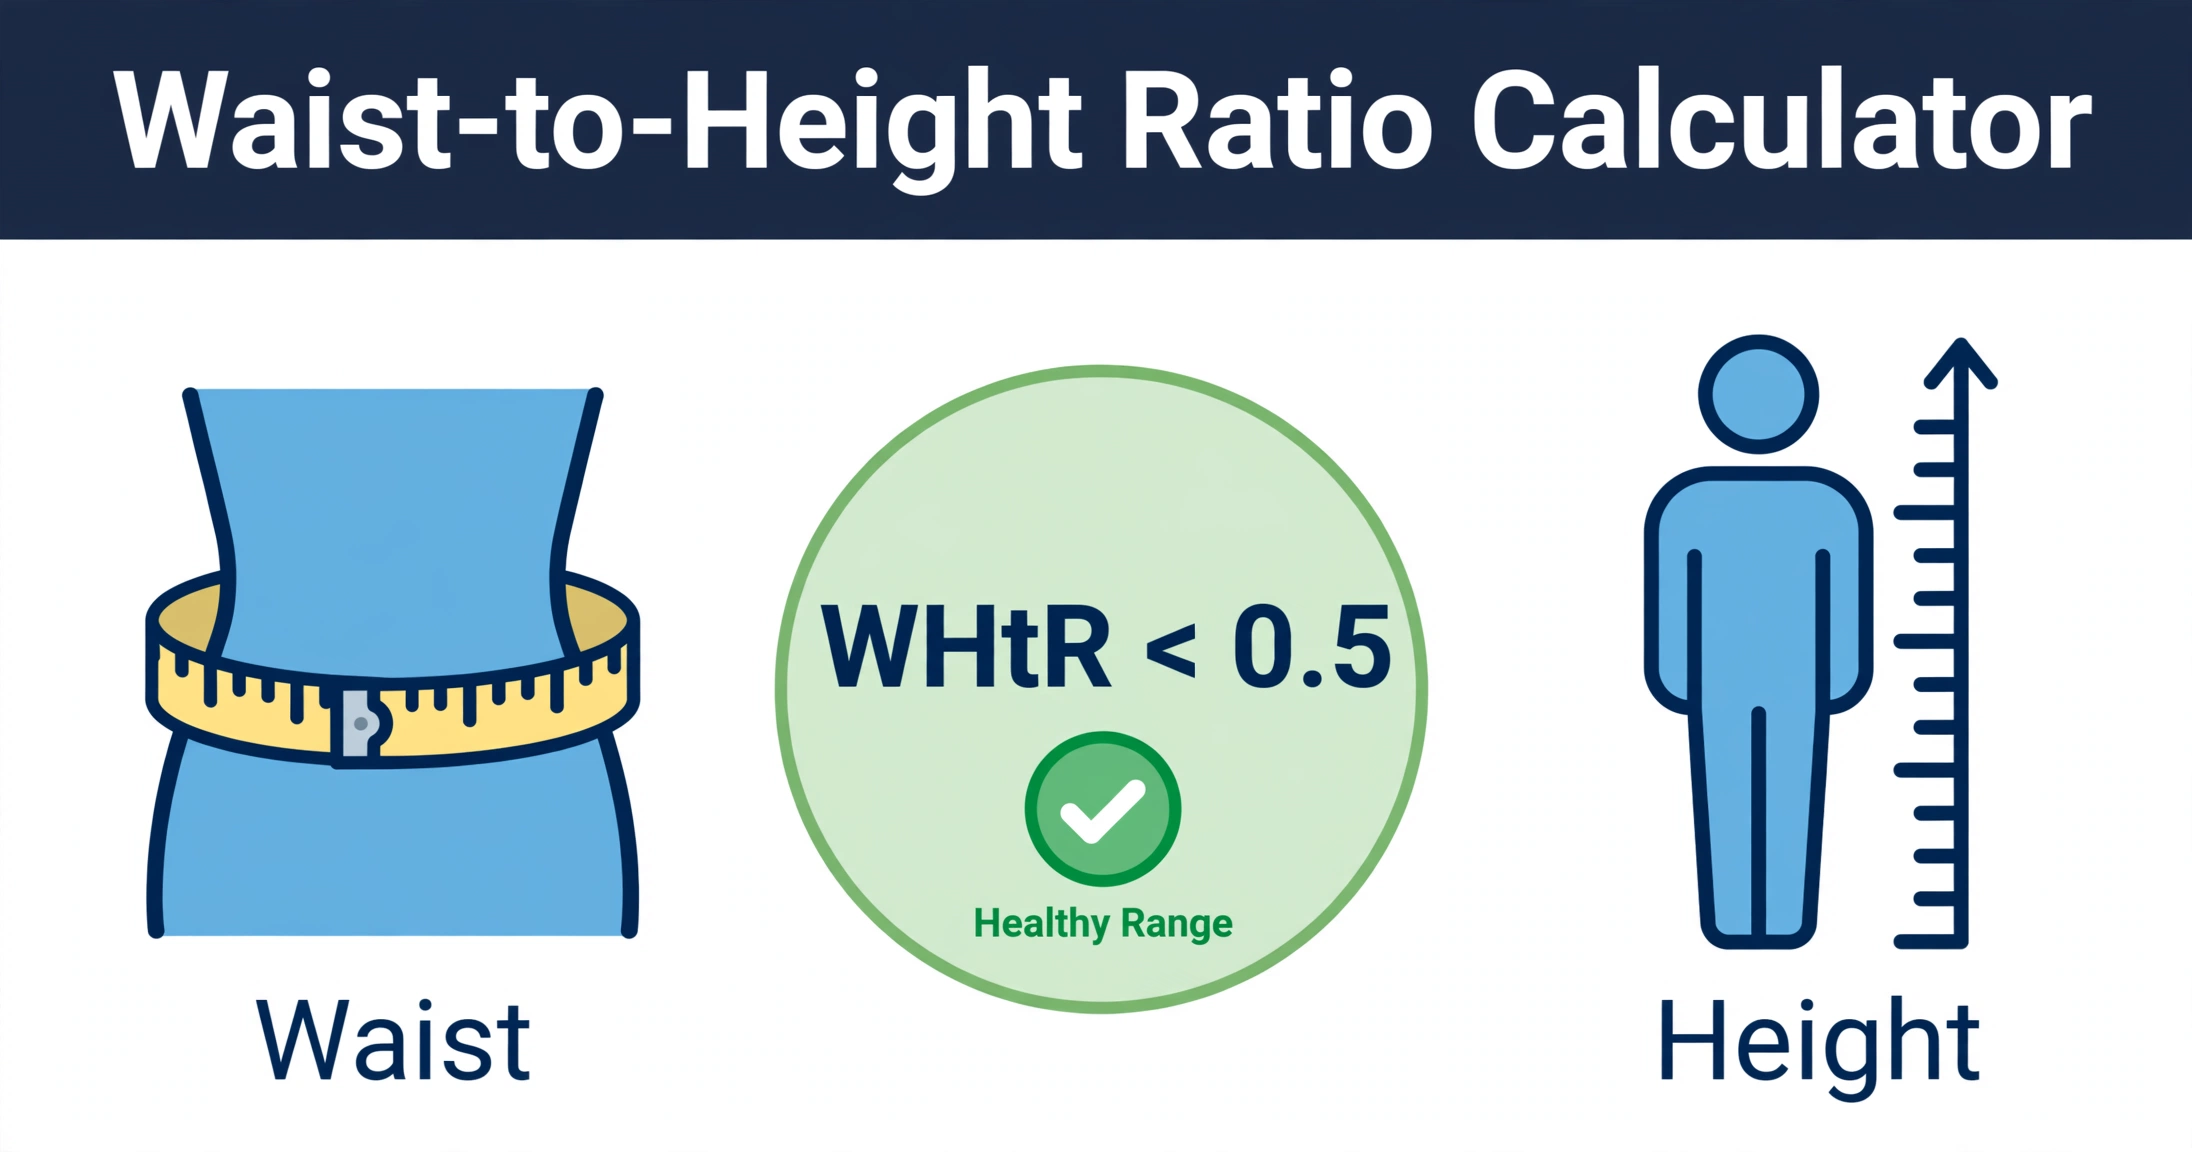
Waist-to-height ratio divides waist circumference by height. A value below 0.5 is the most widely cited healthy threshold, and meta-analyses have found WHtR to predict cardiometabolic risk more strongly than BMI in many populations.
What Is Waist-to-Height Ratio?
Waist-to-height ratio (WHtR) is a measure of central fat distribution obtained by dividing waist circumference by height. Both measurements use the same units, so the ratio is a unit-free number, typically between 0.3 and 0.7 in adults.
The measure gained attention because it adjusts waist size for body frame. A 90 cm waist means something different on a person who is 160 cm tall than on a person who is 190 cm tall. Dividing by height puts the waist measurement in proportion to the skeleton that carries it.
Interest in WHtR grew after large meta-analyses compared it with body mass index (BMI) and waist circumference as predictors of cardiometabolic risk. Ashwell and colleagues, in a systematic review published in Obesity Reviews (2012), found that WHtR outperformed BMI and waist circumference for detecting diabetes, hypertension, dyslipidaemia, and cardiovascular disease risk factors across adult populations.1 A simple public-health message followed: keep your waist to less than half your height.
The United Kingdom's National Institute for Health and Care Excellence (NICE) included waist-to-height ratio in its 2022 guidance on identifying and assessing overweight and obesity in adults, recommending WHtR alongside BMI.2 Clinicians evaluate WHtR as a screening measure of central adiposity, one input among many that include blood pressure, lipids, glucose, smoking status, and family history. A related tool on this site, the waist-to-hip ratio calculator, measures a different aspect of fat distribution.
How Is WHtR Calculated?
WHtR is calculated with a single division: waist circumference divided by height, both in the same units.
For example, a waist of 84 cm and a height of 178 cm gives 84 ÷ 178 = 0.47. The same calculation in inches, 33.1 ÷ 70.1, gives the same ratio, because the units cancel out.
Measurement components
| Component | How It Is Measured | Typical Adult Range | Units |
|---|---|---|---|
| Waist circumference | Midpoint between the lowest rib and the top of the hip bone, at the end of a normal breath out, tape snug but not compressing skin | 60–120 cm | cm or in |
| Height | Standing straight, without shoes, heels together | 150–195 cm | cm or in |
| WHtR | Waist ÷ height | 0.35–0.65 | Unit-free |
Measurement technique matters. Studies of waist measurement reliability show that placing the tape at different landmarks or measuring over clothing shifts results by several centimetres.3 Consistent technique — same landmark, same breathing phase, same tape tension — makes repeated measurements comparable over time.
What Do WHtR Categories Mean?
The most widely cited screening boundary is 0.5. Values below 0.5 are generally described as the healthy range; values at or above 0.5 are associated with increased cardiometabolic risk in population studies.
| WHtR Range | Category | What Research Shows |
|---|---|---|
| Below 0.40 | Below typical range | Uncommon in adults; very low values can reflect low body mass. Measurement technique is worth confirming. |
| 0.40 – 0.49 | Healthy range | Below the 0.5 screening boundary used in guidance and most studies. |
| 0.50 – 0.59 | Elevated | At or above the 0.5 threshold linked to higher cardiometabolic risk in meta-analyses. |
| 0.60 and above | High | Associated with substantially higher risk of diabetes, hypertension, and cardiovascular risk factors.1 |
The 0.5 boundary is a screening threshold, not a diagnostic cutoff. It identifies people whose central fat distribution merits further assessment — blood pressure, lipid panel, fasting glucose — rather than labelling anyone as ill. Browning and colleagues, in a systematic review in Obesity Reviews (2010), found WHtR to be a useful screening tool across ethnic groups, with the 0.5 boundary performing consistently.4
Risk rises along a continuum rather than jumping at exactly 0.5. A ratio of 0.49 and a ratio of 0.51 reflect nearly the same physiology. Clinicians interpret the number in context: a 0.52 in a person with normal blood pressure, lipids, and glucose carries a different meaning than 0.52 alongside hypertension and diabetes.
WHtR vs WHR vs BMI: Which Measure Fits Your Question?
WHtR, waist-to-hip ratio (WHR), and BMI answer different questions about body composition. The calculator above includes all three modes so the same body can be described from each angle.
| Measure | Formula | What It Captures | Key Limitation |
|---|---|---|---|
| WHtR | Waist ÷ height | Central fat relative to frame size | Less validated in children and very muscular adults |
| WHR | Waist ÷ hip | Fat distribution pattern (abdominal vs gluteal) | Hip size also changes with fat, which can mask risk |
| BMI | Weight ÷ height² | Total mass relative to height | Cannot distinguish fat from muscle or bone |
Head-to-head comparisons favour WHtR for cardiometabolic screening. In the Ashwell meta-analysis, WHtR showed stronger associations with diabetes, hypertension, and cardiovascular risk factors than BMI, and stronger associations than waist circumference alone.1 The proposed reason is physiological: visceral fat around the organs drives metabolic risk more than total body mass, and WHtR captures that distribution better than BMI.
BMI retains advantages in other settings. It requires only a scale and a height measure, it has the longest historical record in epidemiology, and drug dosing and many clinical thresholds are defined in BMI units. WHR adds information about fat patterning — an "apple" versus "pear" distribution — and the World Health Organization publishes sex-specific WHR cutoffs (0.90 for men, 0.85 for women).5 Many researchers report two or three of these measures together rather than choosing one. For a fuller picture of body composition, the body fat calculator estimates fat percentage from skinfold-style inputs.
Limitations of Waist-to-Height Ratio
WHtR is a screening measure with known limits. It does not measure visceral fat directly — imaging such as CT or MRI is required for that — and it cannot distinguish subcutaneous from visceral abdominal fat.
WHtR also says nothing about the other drivers of cardiovascular risk. Blood pressure, LDL cholesterol, smoking, diabetes, and family history each contribute independently to risk models such as the ASCVD risk calculator. A healthy WHtR does not cancel out hypertension, just as an elevated WHtR does not by itself establish disease.
Where WHtR is most useful is as an early, low-cost signal. It needs no laboratory test, no scale calibration beyond a tape measure, and no clinic visit. When the ratio crosses 0.5, it prompts the assessments that do require a clinic: blood pressure measurement, lipid panel, and glucose testing.
Worked Example
Profile: a 52-year-old man, waist 96 cm, height 172 cm, hip 102 cm, weight 86 kg.
WHtR: 96 ÷ 172 = 0.56 → elevated (at or above 0.5).
WHR: 96 ÷ 102 = 0.94 → moderate range for men (0.90–0.99).
BMI: 86 ÷ 1.72² = 86 ÷ 2.9584 = 29.1 kg/m² → overweight range (25–29.9).
Interpretation: all three measures point in the same direction — central adiposity above screening thresholds with total mass in the overweight range. The pattern is consistent: the elevated WHtR flags central fat distribution, and the BMI confirms excess total mass. A clinician evaluating this profile would typically check blood pressure, lipids, and glucose next.
Quick Reference: Common Waist–Height Combinations
| Waist | Height 160 cm | Height 170 cm | Height 180 cm | Height 190 cm |
|---|---|---|---|---|
| 70 cm | 0.44 | 0.41 | 0.39 | 0.37 |
| 80 cm | 0.50 | 0.47 | 0.44 | 0.42 |
| 90 cm | 0.56 | 0.53 | 0.50 | 0.47 |
| 100 cm | 0.63 | 0.59 | 0.56 | 0.53 |
| 110 cm | 0.69 | 0.65 | 0.61 | 0.58 |
Values at or above 0.50 are shaded by the 0.5 screening boundary. The table shows why height matters: a 90 cm waist is 0.56 on a 160 cm frame but 0.47 on a 190 cm frame.
Key Takeaways
- WHtR = waist ÷ height. Below 0.5 is the widely cited healthy threshold: keep your waist to less than half your height.
- Meta-analyses found WHtR a stronger predictor of cardiometabolic risk than BMI in many populations.1
- Measure waist at the midpoint between rib and hip bone, at the end of a normal breath out, with the same units as height.
- WHtR is a screening measure: it flags central fat distribution but does not replace blood pressure, lipid, or glucose assessment.
- Use the three-mode toggle above to compare WHtR with WHR and BMI on the same body.
Frequently Asked Questions
Is waist-to-height ratio better than BMI?
Meta-analyses have found waist-to-height ratio to be a stronger predictor of cardiometabolic risk than BMI in many populations. Ashwell and colleagues reported in Obesity Reviews (2012) that WHtR outperformed both BMI and waist circumference for detecting diabetes, hypertension, and cardiovascular disease risk factors. BMI cannot distinguish fat mass from lean mass, while WHtR reflects central fat distribution. Each measure has limitations, so researchers often report them together.
What is a healthy waist-to-height ratio?
A ratio below 0.5 is the most widely cited healthy threshold, summarized by the message keep your waist to less than half your height. Ratios from 0.5 to 0.59 fall in a borderline or elevated range in many studies, while ratios of 0.6 and above are associated with substantially higher cardiometabolic risk. These are screening thresholds, not diagnostic cutoffs.
How do I measure my waist correctly for WHtR?
Measure at the midpoint between the lowest rib and the top of the hip bone, at the end of a normal breath out, with the tape snug against the skin but not compressing it. Measure height standing straight without shoes. Use the same units for waist and height so the ratio is unit-free.
Does the 0.5 cutoff apply to children or athletes?
The 0.5 boundary has been validated across adult ages, sexes, and ethnic groups in large meta-analyses. It is less established for children, whose body proportions change with growth, and for very muscular individuals, in whom a large waist may reflect muscle rather than fat. In these groups, clinicians interpret WHtR alongside other measures.
Sources
- Ashwell M, Gunn P, Gibson S. Waist-to-height ratio is a better screening tool than waist circumference and BMI for adult cardiometabolic risk factors: systematic review and meta-analysis. Obesity Reviews. 2012;13(3):275-286. doi:10.1111/j.1467-789X.2011.00952.x
- National Institute for Health and Care Excellence (NICE). Obesity: identification, assessment and management — guidance update including waist-to-height ratio. 2022. nice.org.uk/guidance/ng246
- World Health Organization. Waist circumference and waist–hip ratio: report of a WHO expert consultation. Geneva: WHO; 2008. who.int
- Browning LM, Hsieh SD, Ashwell M. A systematic review of waist-to-height ratio as a screening tool for the prediction of cardiovascular disease and diabetes: 0.5 could be a suitable global boundary value. Obesity Reviews. 2010;11(4):293-303. doi:10.1111/j.1467-789X.2009.00641.x
- World Health Organization. Obesity: preventing and managing the global epidemic. WHO Technical Report Series 894. Geneva: WHO; 2000. (WHR cutoffs: 0.90 men, 0.85 women.)
Reviewed by the Medical Editorial Team — October 2026. Content is updated when new guidance or evidence emerges.
Documents the published equation, required inputs, intended population, and known limitations for each tool. This editorial work does not replace advice from a licensed healthcare professional.